Fig. 2
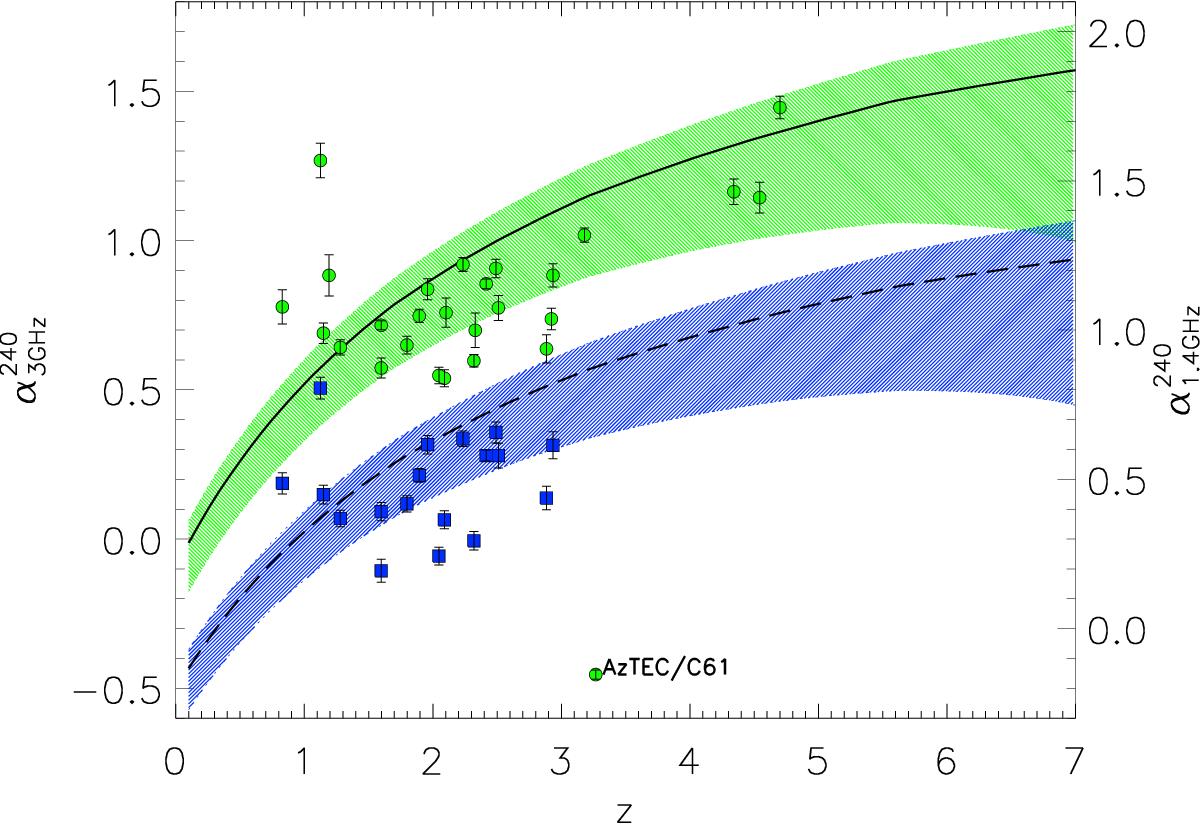
Modeled radio-mm spectral indices, α as a function of redshift. The solid and dashed lines correspond to ![]() and
and ![]() , respectively, while the green and blue hashed regions correspond to the uncertainty range due to varying dust SED temperatures spanning 25 to 60 K. The axes for the two spectral indices have been offset for clarity. Green circles and blue squares indicate those sources in our sample with spectroscopic redshifts which are detected at 3 and 1.4 GHz, respectively. AzTEC/C61 demonstrates an inverted radio spectrum and is suspected of hosting an AGN, so its extreme spectral index is not used as a redshift indicator (Miettinen et al. 2017a).
, respectively, while the green and blue hashed regions correspond to the uncertainty range due to varying dust SED temperatures spanning 25 to 60 K. The axes for the two spectral indices have been offset for clarity. Green circles and blue squares indicate those sources in our sample with spectroscopic redshifts which are detected at 3 and 1.4 GHz, respectively. AzTEC/C61 demonstrates an inverted radio spectrum and is suspected of hosting an AGN, so its extreme spectral index is not used as a redshift indicator (Miettinen et al. 2017a).
Current usage metrics show cumulative count of Article Views (full-text article views including HTML views, PDF and ePub downloads, according to the available data) and Abstracts Views on Vision4Press platform.
Data correspond to usage on the plateform after 2015. The current usage metrics is available 48-96 hours after online publication and is updated daily on week days.
Initial download of the metrics may take a while.