Fig. B.1
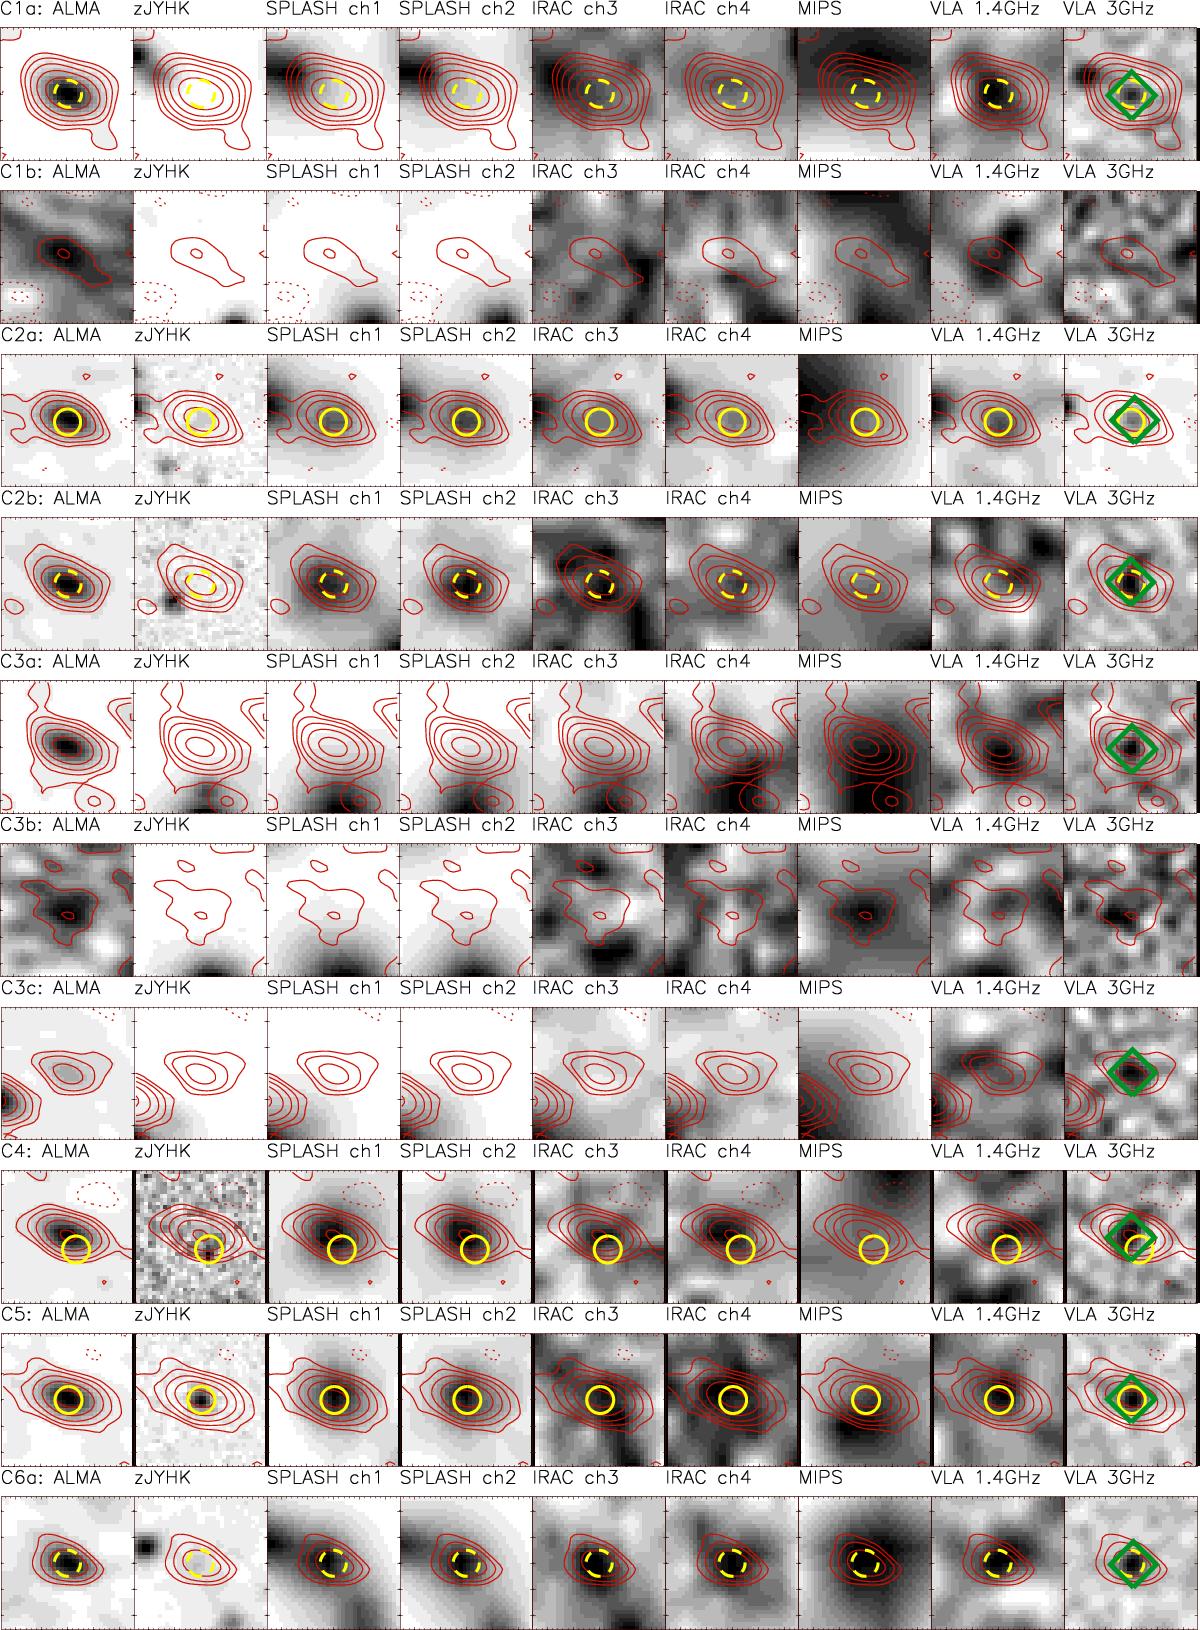
Gray-scale images (5″ on the side) in various bands (indicated above each panel) for each ALMA detected SMG. The contours shown by solid lines represent the flux levels in the ALMA maps at 2n × RMS for n = 2,3,4,... (negative contours at the same levels are shown by dotted lines). The assumed counterparts are encircled by a full yellow line if present in the COSMOS2015 catalog, otherwise by a dashed yellow line (indicating that the multi-wavelength photometry was specifically extracted here; see text for details). Radio counterparts at 3 GHz are marked by the green diamond.
Current usage metrics show cumulative count of Article Views (full-text article views including HTML views, PDF and ePub downloads, according to the available data) and Abstracts Views on Vision4Press platform.
Data correspond to usage on the plateform after 2015. The current usage metrics is available 48-96 hours after online publication and is updated daily on week days.
Initial download of the metrics may take a while.