Fig. 1
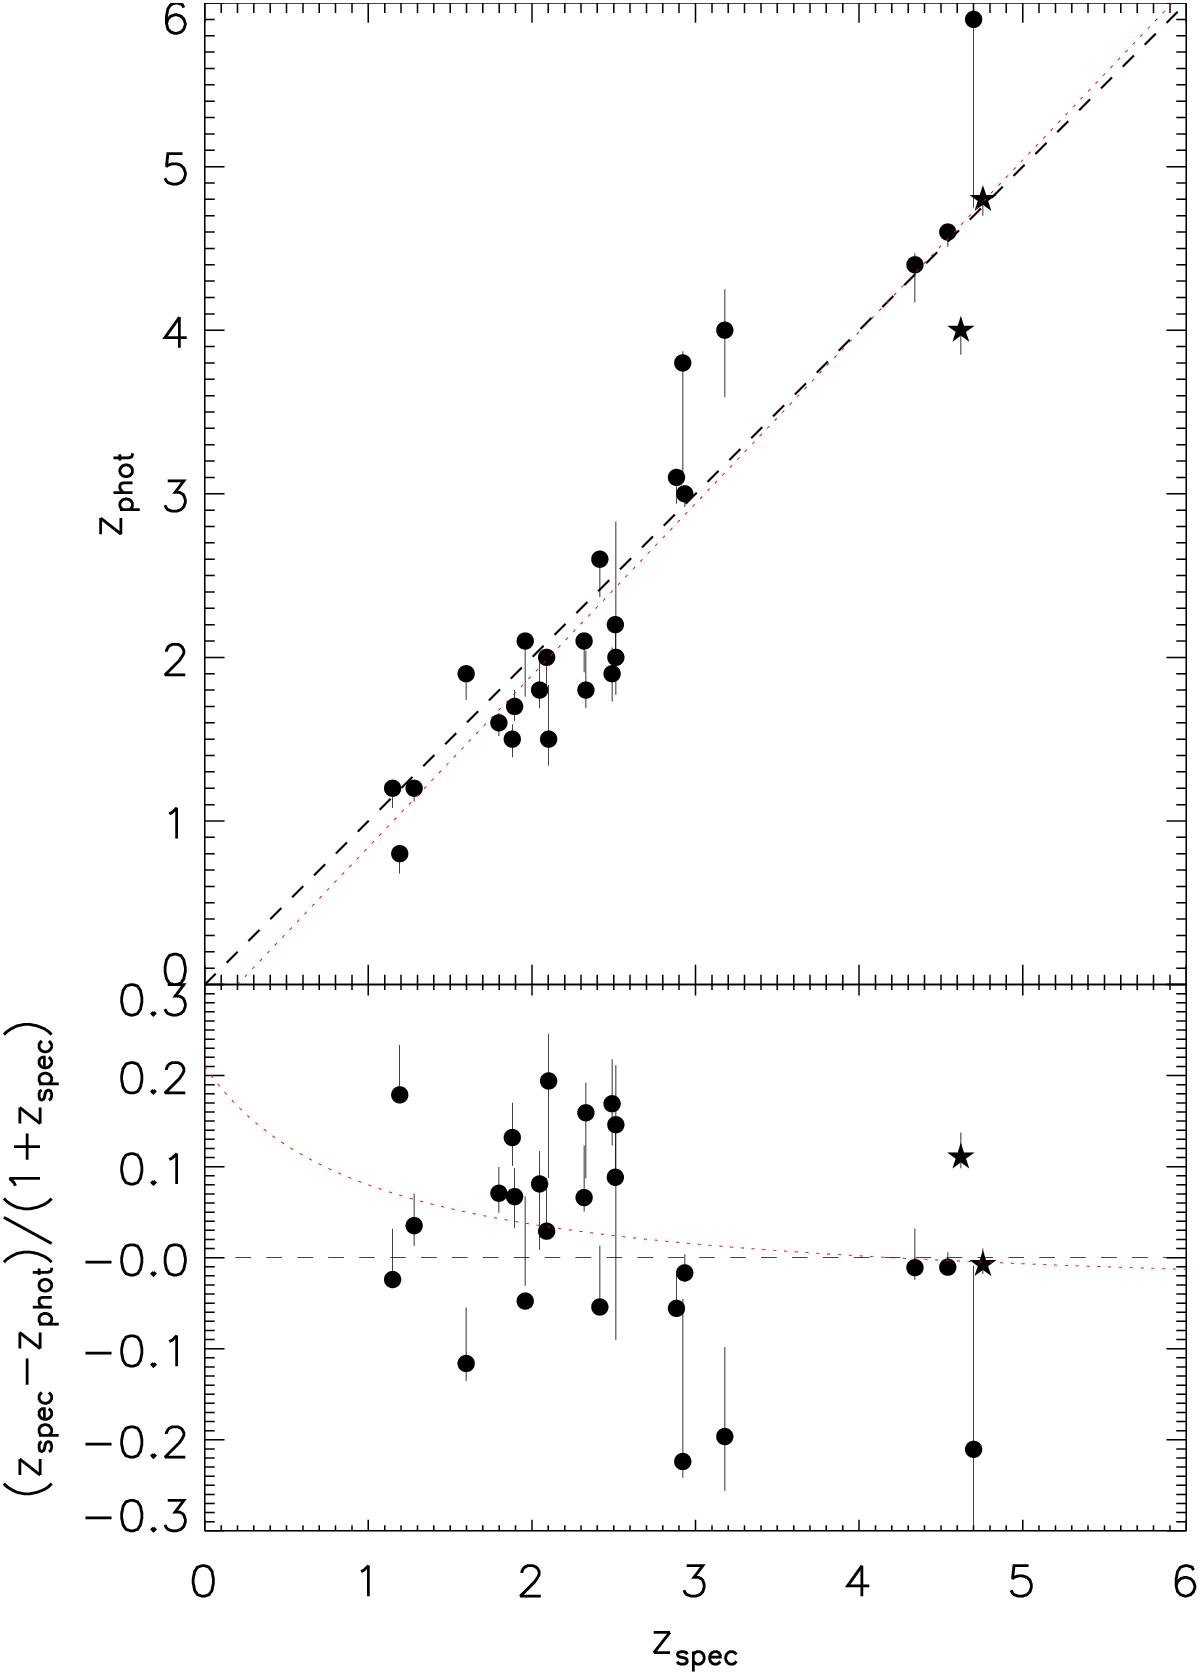
Top panel: measured zphot as a function of zspec. zphot = zspec is plotted as a dashed black line. Four sources from our sample with ambiguous photometric redshifts have been ignored. We have also included two sources from outside our sample, AK03 and Vd-17871 (zspec = 4.757 and 4.622, respectively), plotted as stars. These were fit photometrically in an identical manner and are included to improve the robustness of our fit. We detect a slight systematic offset with zspec (Eq. (1)) plotted as a red dotted line. Bottom panel: Δz/ (1 + zspec) as a function of zspec. With data and Eq. (1) plotted as in the top panel.
Current usage metrics show cumulative count of Article Views (full-text article views including HTML views, PDF and ePub downloads, according to the available data) and Abstracts Views on Vision4Press platform.
Data correspond to usage on the plateform after 2015. The current usage metrics is available 48-96 hours after online publication and is updated daily on week days.
Initial download of the metrics may take a while.