Fig. 9
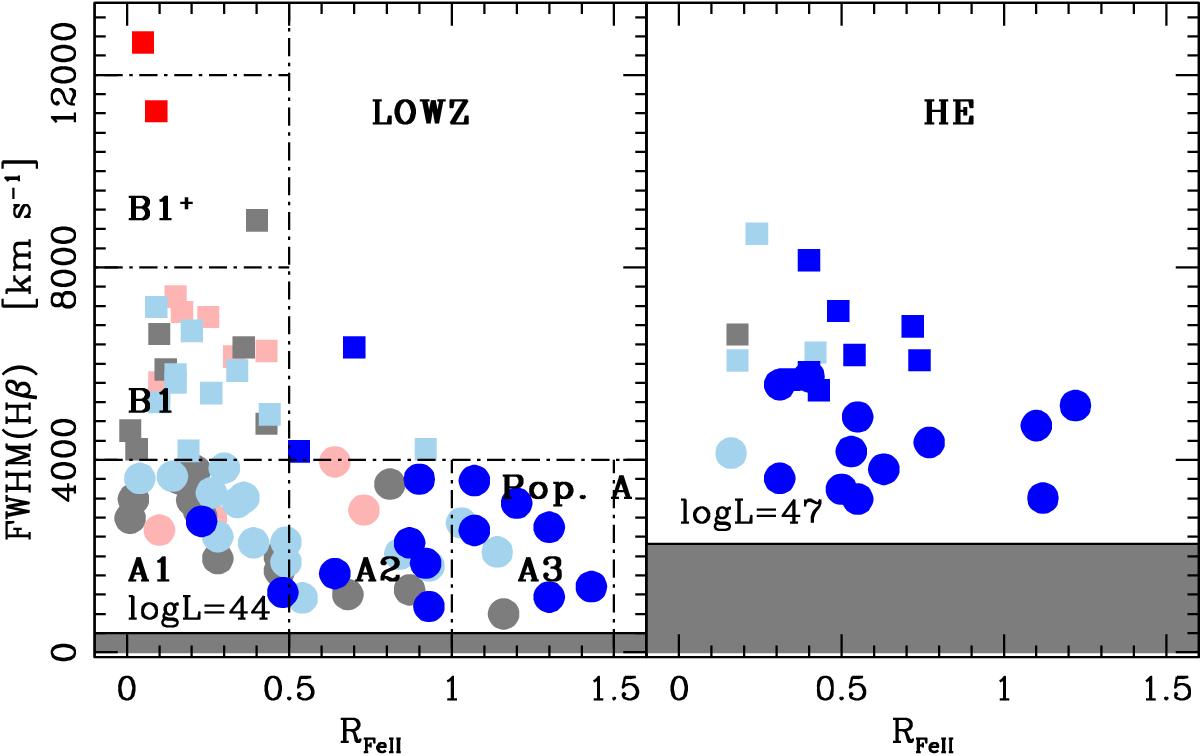
Amplitude of Civ![]() in the 4DE1 optical plane (FWHM HβBC vs. RFeII). Population A and B sources are marked as circles and squares, respectively. Colors represent shift amplitudes. Blue: large Civ blueshifts (
in the 4DE1 optical plane (FWHM HβBC vs. RFeII). Population A and B sources are marked as circles and squares, respectively. Colors represent shift amplitudes. Blue: large Civ blueshifts (![]() >− 1000 km s-1), aquamarine: significant blueshifts (
>− 1000 km s-1), aquamarine: significant blueshifts (![]() = − 200 to − 1000 km s-1); gray: no significant shift (|
= − 200 to − 1000 km s-1); gray: no significant shift (|![]() | < 200 km s-1). Red and pink, large and significant
| < 200 km s-1). Red and pink, large and significant ![]() redshift, respectively. Left: 4DE1 plane for the RQ LOWZ sample. Right: 4DE1 plane for HE sample. The horizontal filled lines mark the minimum FWHM Hβ for virialized systems at log L = 44 and 47 (no sources may exist in the shaded area, Marziani et al. 2009).
redshift, respectively. Left: 4DE1 plane for the RQ LOWZ sample. Right: 4DE1 plane for HE sample. The horizontal filled lines mark the minimum FWHM Hβ for virialized systems at log L = 44 and 47 (no sources may exist in the shaded area, Marziani et al. 2009).
Current usage metrics show cumulative count of Article Views (full-text article views including HTML views, PDF and ePub downloads, according to the available data) and Abstracts Views on Vision4Press platform.
Data correspond to usage on the plateform after 2015. The current usage metrics is available 48-96 hours after online publication and is updated daily on week days.
Initial download of the metrics may take a while.