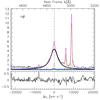
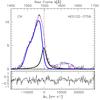
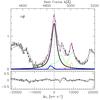
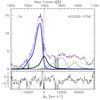
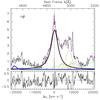
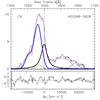
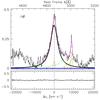
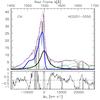
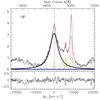
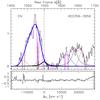
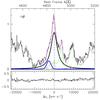
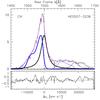
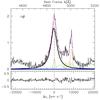
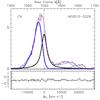
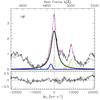
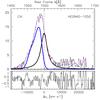
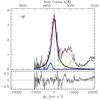
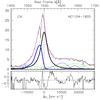
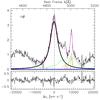
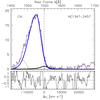
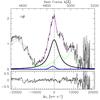
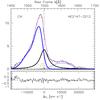
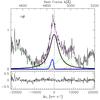
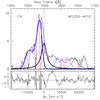
Fig. 4
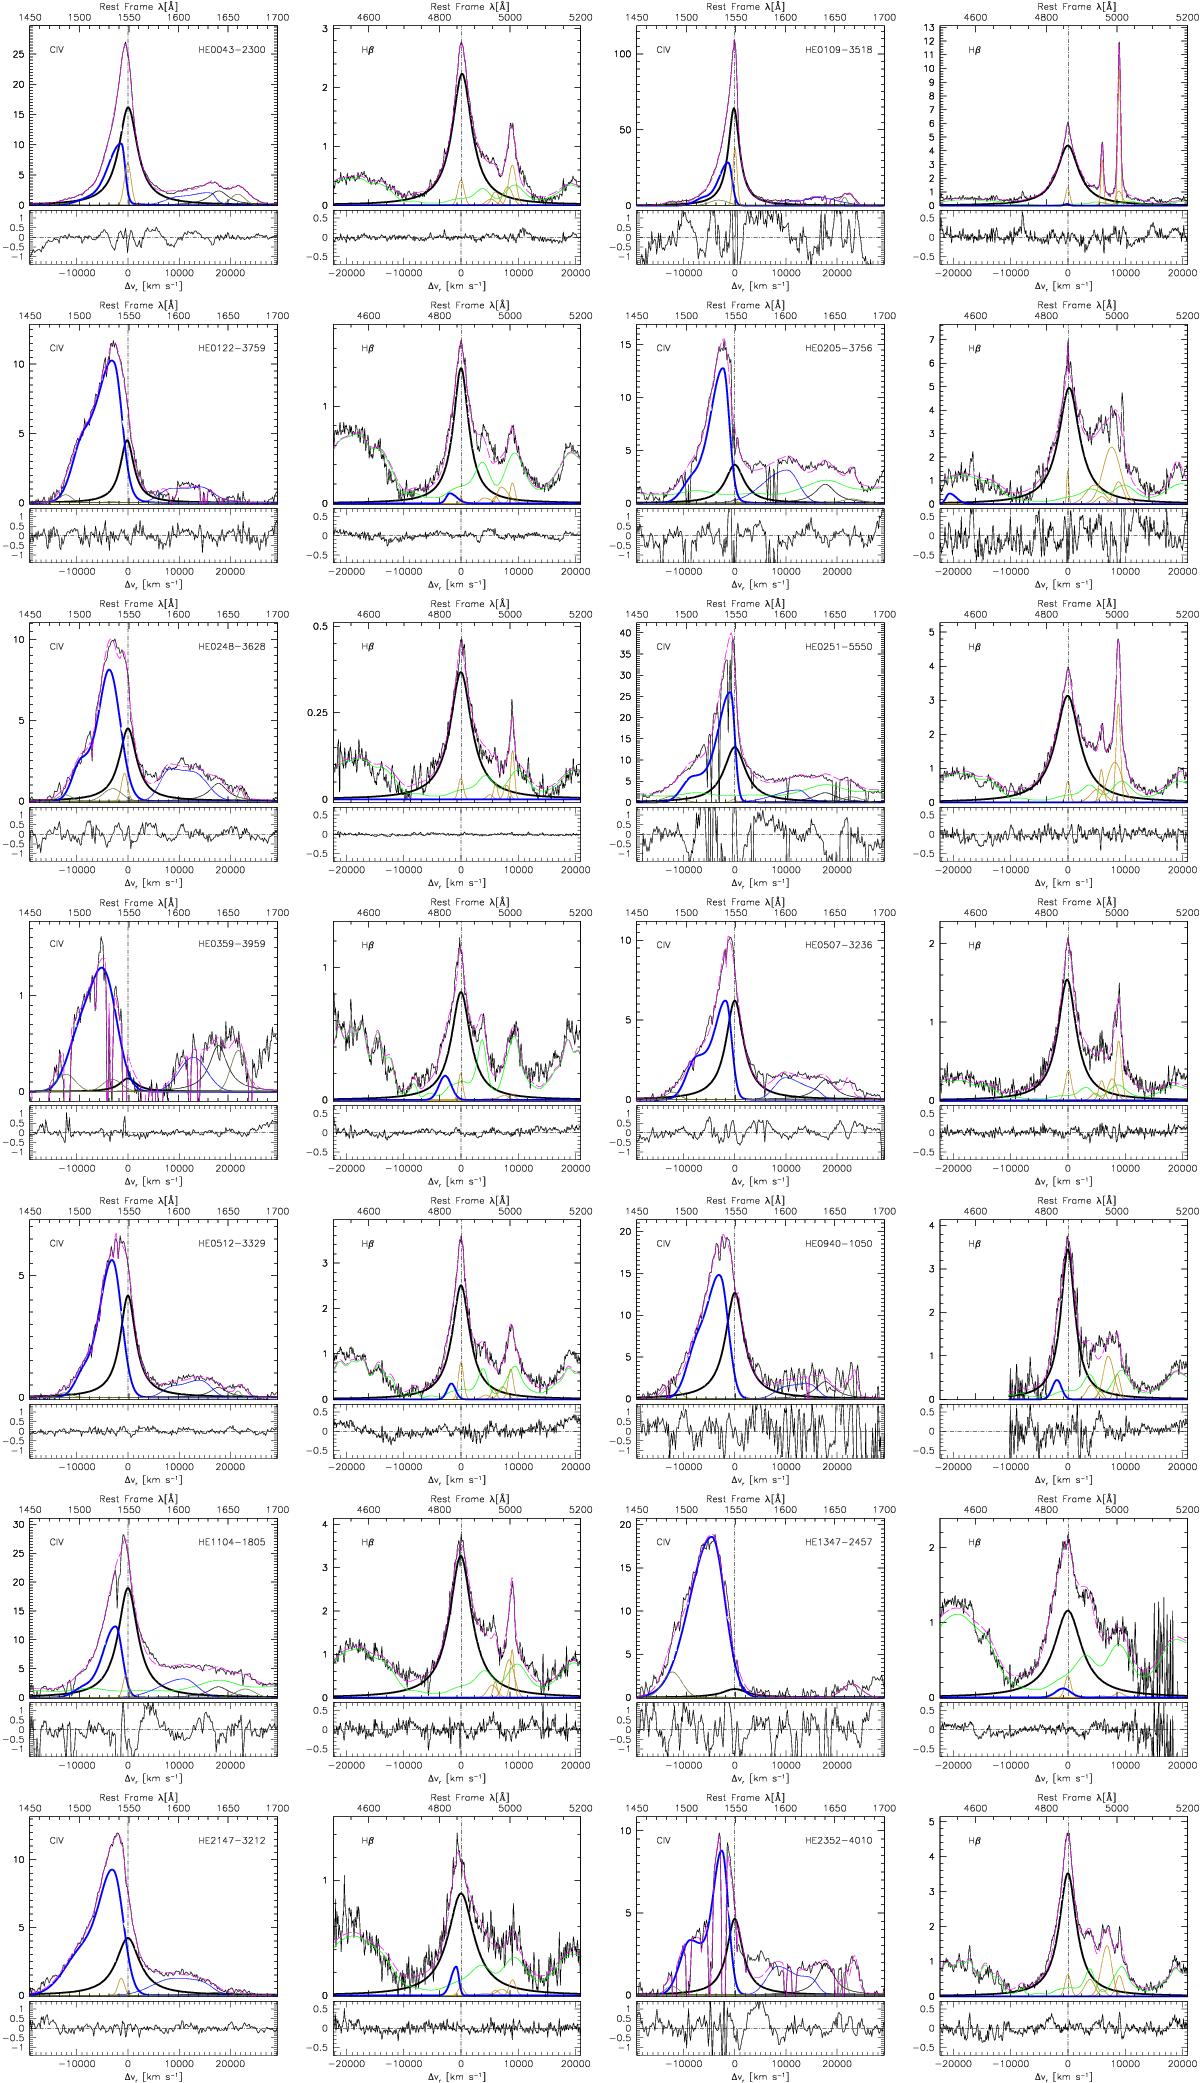
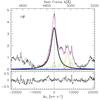
Results of the specfit analysis on the spectra of Pop. A sources in the HE sample, in the Civ and Hβ spectral range (adjacent left and right panels), after continuum subtraction. Horizontal scale is rest frame wavelength in Å or radial velocity shift from Civ rest wavelength (left) or Hβ (right) marked by dot dashed lines; vertical scale is specific flux in units of 10-15 erg s-1 cm-2 Å-1. The panels show the emission line components used in the fit: Feii emission (green), BC (thick black), and BLUE (thick blue), narrow lines (orange). The Oiii]λ1663 line at ≈1660 Å is shown in gray. Thin blue and black lines trace the BLUE and BC for Heiiλ1640. The lower panels show (observed – specfit model) residuals.
Current usage metrics show cumulative count of Article Views (full-text article views including HTML views, PDF and ePub downloads, according to the available data) and Abstracts Views on Vision4Press platform.
Data correspond to usage on the plateform after 2015. The current usage metrics is available 48-96 hours after online publication and is updated daily on week days.
Initial download of the metrics may take a while.