Fig. 11
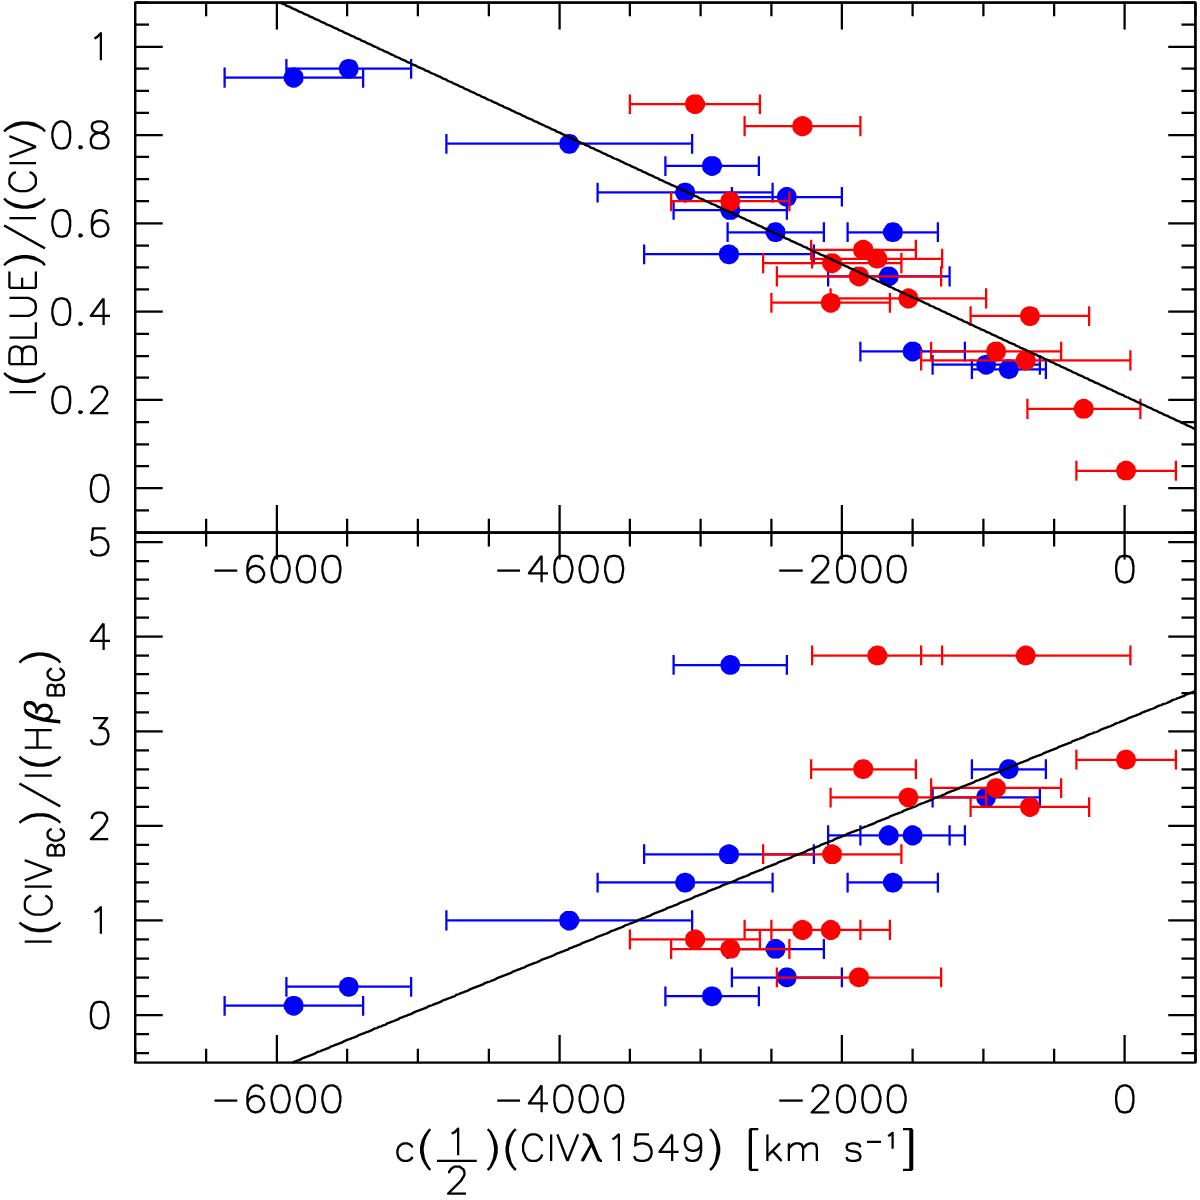
Relation between ![]() Civ and intensity ratio between the BLUE component and the full Civ line (upper panel), and intensity ratio of the broad components of Civ and Hβ (lower panel) for the sources of the HE sample. The horizontal scale is in units of km s-1. Population A sources are indicated by blue symbols and Pop. B by red ones.
Civ and intensity ratio between the BLUE component and the full Civ line (upper panel), and intensity ratio of the broad components of Civ and Hβ (lower panel) for the sources of the HE sample. The horizontal scale is in units of km s-1. Population A sources are indicated by blue symbols and Pop. B by red ones.
Current usage metrics show cumulative count of Article Views (full-text article views including HTML views, PDF and ePub downloads, according to the available data) and Abstracts Views on Vision4Press platform.
Data correspond to usage on the plateform after 2015. The current usage metrics is available 48-96 hours after online publication and is updated daily on week days.
Initial download of the metrics may take a while.