Fig. 1
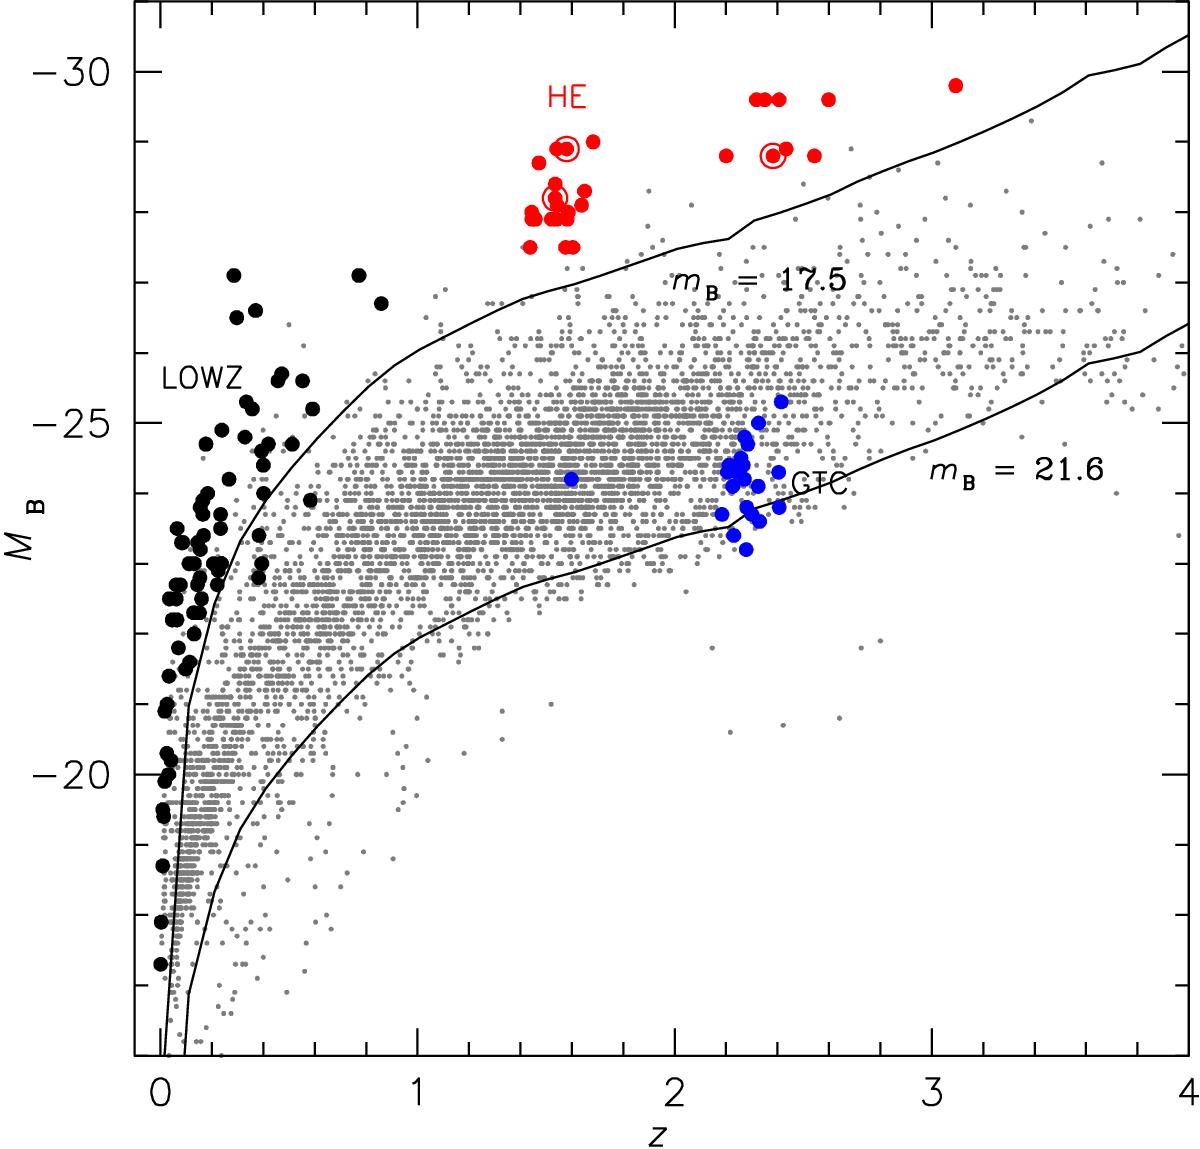
Location of the HE sample in the plane MB vs. redshift (red spots), superimposed to a random subsample of the Véron-Cetty & Véron (2010) catalog (gray dots). Data points representing our low-z RQ control sample and GTC sample of faint quasars at z ~ 2.3 are also shown as black and blue filled circles respectively. The MB associated with two apparent magnitude limited sample (17.5 appropriate for the HE survey, and 21.6 for the SDSS) are shown as a function of redshift.
Current usage metrics show cumulative count of Article Views (full-text article views including HTML views, PDF and ePub downloads, according to the available data) and Abstracts Views on Vision4Press platform.
Data correspond to usage on the plateform after 2015. The current usage metrics is available 48-96 hours after online publication and is updated daily on week days.
Initial download of the metrics may take a while.