Free Access
Fig. 7
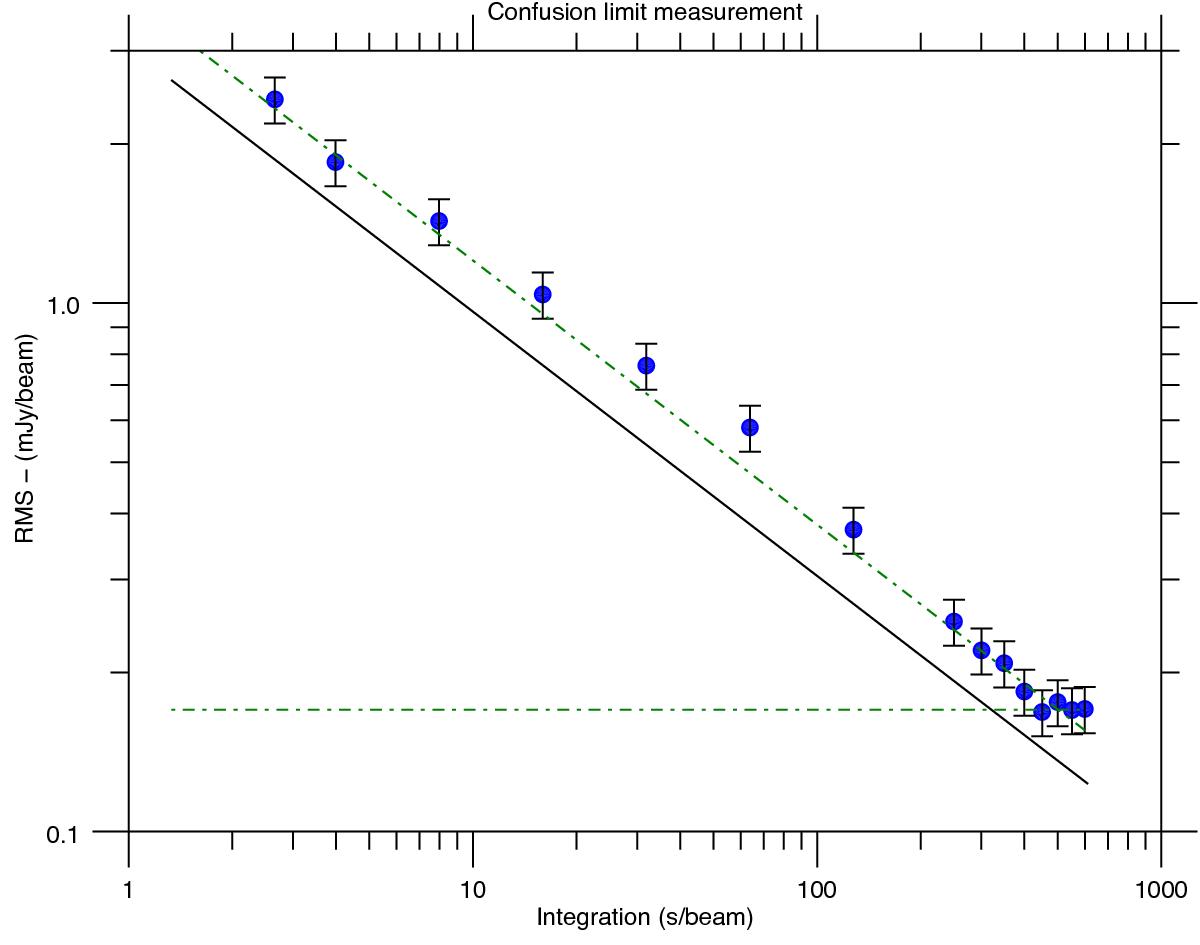
Measured RMS noise as a function of integration time. The oblique solid line shows the expected trend according to the radiometer equation. The parallel dot-dashed line corresponds to the theoretical noise increased by 25%. The horizontal dot-dashed line shows the measured confusion limit.
Current usage metrics show cumulative count of Article Views (full-text article views including HTML views, PDF and ePub downloads, according to the available data) and Abstracts Views on Vision4Press platform.
Data correspond to usage on the plateform after 2015. The current usage metrics is available 48-96 hours after online publication and is updated daily on week days.
Initial download of the metrics may take a while.