Fig. 2
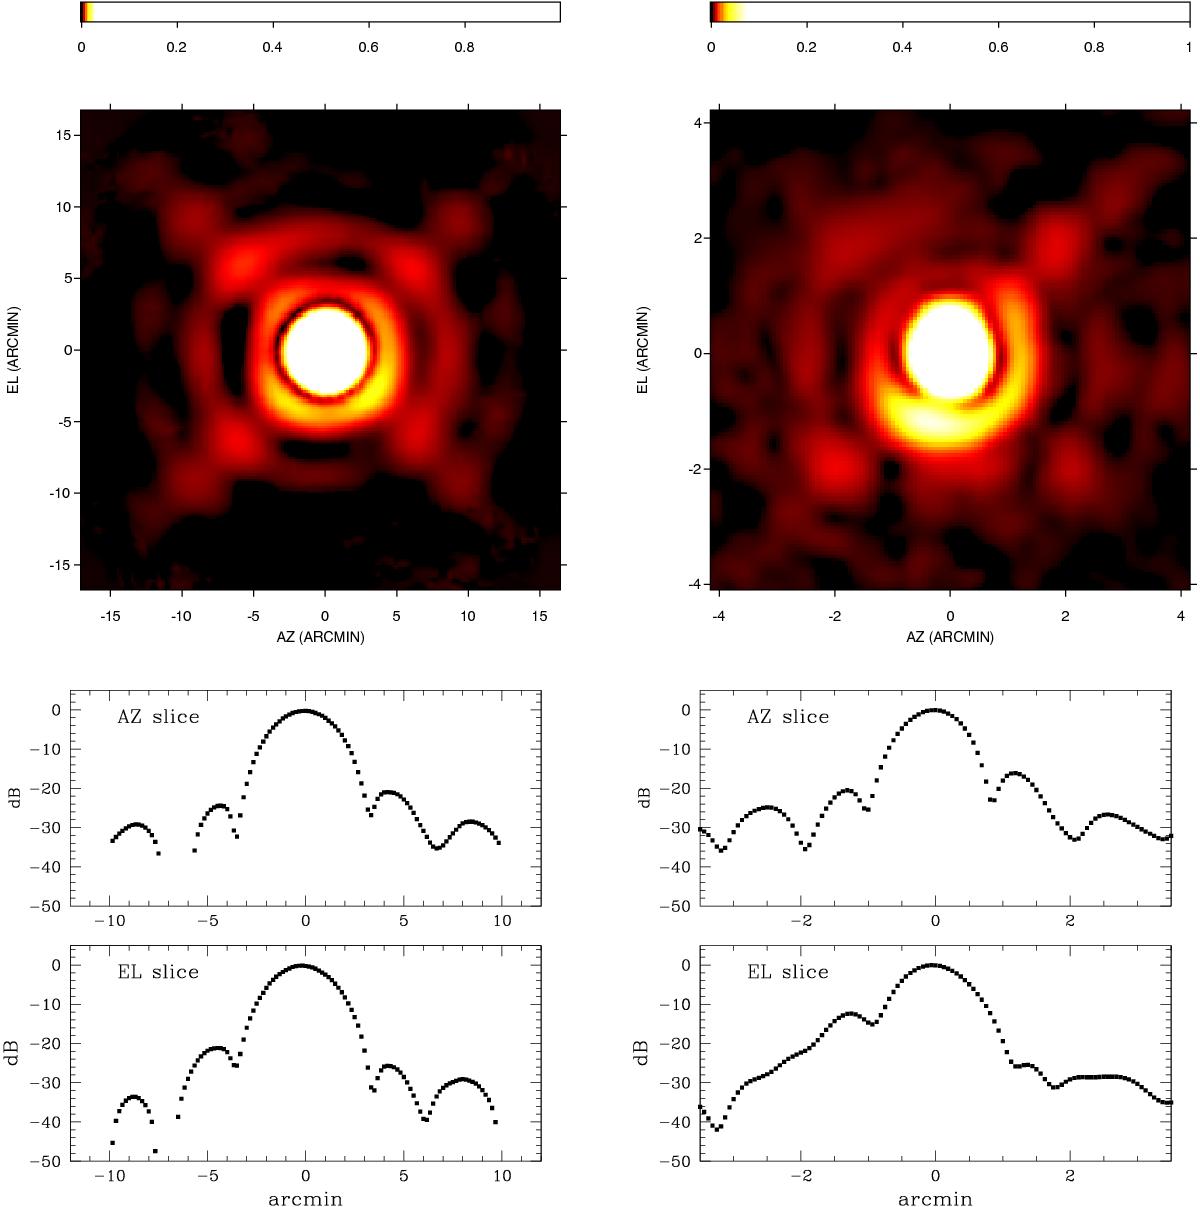
SRT beam patterns at C-band (7.24 GHz, left-column panels) and K-band (right-column panels) respectively. For K-band we show only the 25.54 GHz measurement of the central beam. Top: elevation-averaged beam patterns (normalized to a peak value of 1) obtained by stacking together several OTF scans of bright point sources taken at different elevations. The color map has been intentionally saturated to highlight the low intensity features of the second and third lobes. Bottom: beam cross-sections along the azimuth and elevation axes (in dB).
Current usage metrics show cumulative count of Article Views (full-text article views including HTML views, PDF and ePub downloads, according to the available data) and Abstracts Views on Vision4Press platform.
Data correspond to usage on the plateform after 2015. The current usage metrics is available 48-96 hours after online publication and is updated daily on week days.
Initial download of the metrics may take a while.