Fig. 14
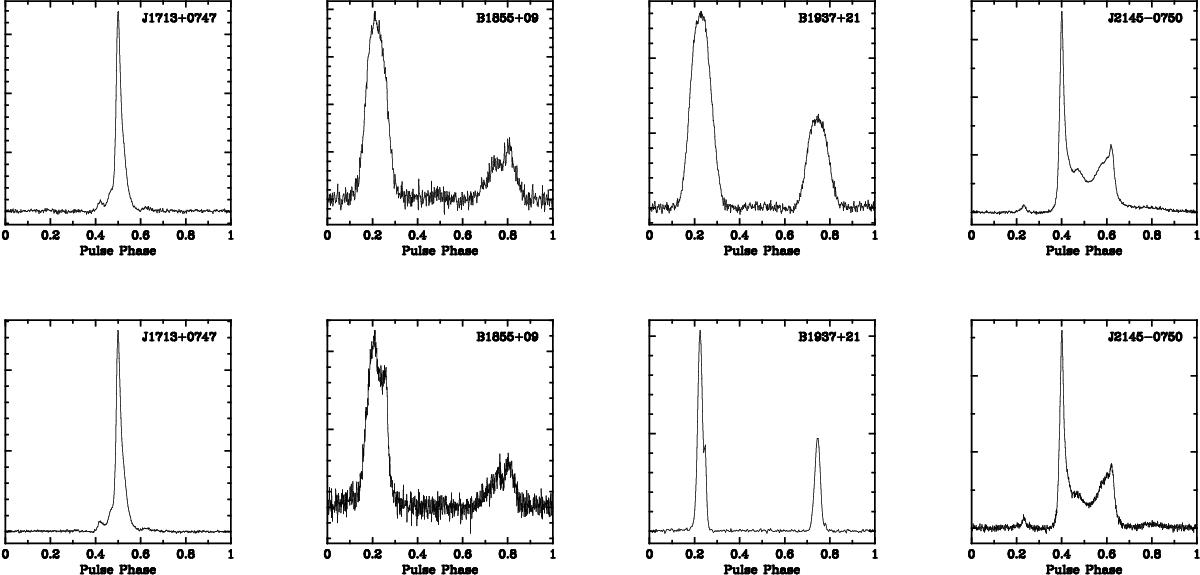
Pulse profiles at 1550 MHz for the four MSPs observed both at C and L bands. The name of each pulsar is written on the top right corner of each panel. The top row shows the pulses as observed with the DFB3, while in the bottom row we show those obtained with the ROACH board. The plots for the two backends are not obtained simultaneously, so the S/N of the two profiles are not directly comparable. We also note that three of these pulsars (all except B1937+21) are heavily affected by interstellar scintillation.
Current usage metrics show cumulative count of Article Views (full-text article views including HTML views, PDF and ePub downloads, according to the available data) and Abstracts Views on Vision4Press platform.
Data correspond to usage on the plateform after 2015. The current usage metrics is available 48-96 hours after online publication and is updated daily on week days.
Initial download of the metrics may take a while.