Fig. 1
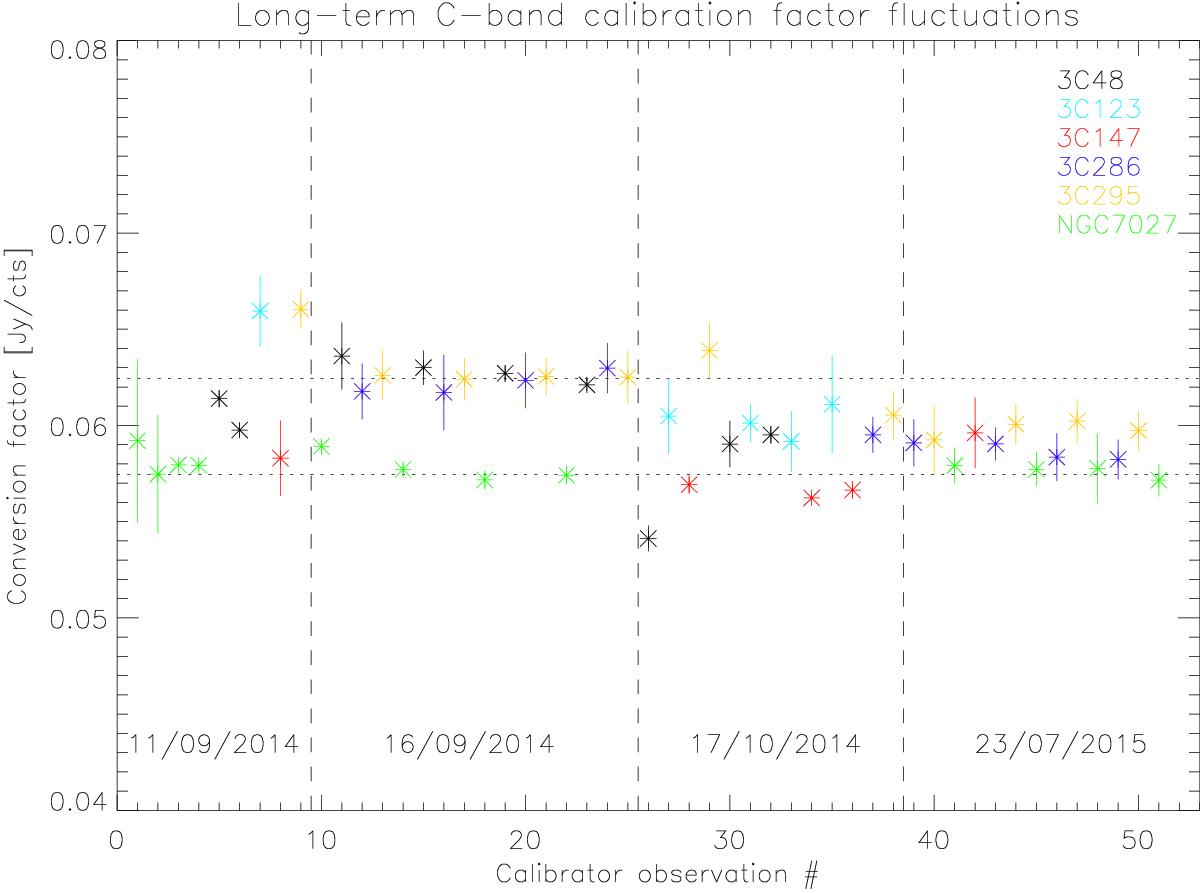
C-band Jansky-to-counts conversion factor as measured for different calibrators in four observing sessions (separated by dashed vertical lines), spread over a 10-month timescale. Different colors correspond to different calibrators, as labeled in the panel. The dashed horizontal lines indicate the ± 0.002 rms variations around the average value of 0.06. For each observing session we report the date of the observations.
Current usage metrics show cumulative count of Article Views (full-text article views including HTML views, PDF and ePub downloads, according to the available data) and Abstracts Views on Vision4Press platform.
Data correspond to usage on the plateform after 2015. The current usage metrics is available 48-96 hours after online publication and is updated daily on week days.
Initial download of the metrics may take a while.