| Issue |
A&A
Volume 608, December 2017
|
|
|---|---|---|
| Article Number | A82 | |
| Number of page(s) | 18 | |
| Section | Interstellar and circumstellar matter | |
| DOI | https://doi.org/10.1051/0004-6361/201630177 | |
| Published online | 08 December 2017 | |
The onset of energetic particle irradiation in Class 0 protostars⋆
1 Univ. Grenoble Alpes, IPAG, 38000 Grenoble, France
e-mail: cfavre@arcetri.astro.it
2 CNRS, IPAG, 38000 Grenoble, France
3 Institut de Radioastronomie Millimétrique, 300 rue de la Piscine, 38406 Saint Martin d’ Hères, France
4 Astronomical Institute “Anton Pannekoek”, University of Amsterdam, Kruislaan 403, 1098 SJ Amsterdam, The Netherlands
5 Max-Planck-Institute for Extraterrestrial Physics (MPE), Giessenbachstr. 1, 85748 Garching, Germany
6 Université de Toulouse, UPS-OMP, IRAP, 31013 Toulouse, France
7 CNRS, IRAP, 9 Av. colonel Roche, BP 44346, 31028 Toulouse Cedex 4, France
8 Observatorio Astronómico Nacional (OAN, IGN), Apdo 112, 28803 Alcalá de Henares, Spain
9 Leiden Observatory, PO Box 9513, 2300 RA, Leiden, The Netherlands
10 LERMA, Observatoire de Paris, PSL Research University, CNRS, Sorbonne Universités, UPMC Univ. Paris 06, 75014 Paris, France
11 Cahill Center for Astronomy and Astrophysics 301-17, California Institute of Technology, Pasadena, CA 91125, USA
12 Institut d’Astrophysique de Paris, 98bis Bd Arago, 75014 Paris, France
13 INAF–Osservatorio Astrofisico di Arcetri, Largo E. Fermi, 5, 50125 Firenze, Italy
Received: 1 December 2016
Accepted: 21 August 2017
Context. The early stages of low-mass star formation are likely to be subject to intense ionization by protostellar energetic MeV particles. As a result, the surrounding gas is enriched in molecular ions, such as HCO+ and N2H+. Nonetheless, this phenomenon remains poorly understood for Class 0 objects. Recently, based on Herschel observations taken as part of the key programme Chemical HErschel Surveys of Star forming regions (CHESS), a very low HCO+/N2H+ abundance ratio of about three to four, has been reported towards the protocluster OMC-2 FIR4. This finding suggests a cosmic-ray ionization rate in excess of 10-14 s-1, much higher than the canonical value of ζ = 3 × 10-17 s-1 (value expected in quiescent dense clouds).
Aims. We aim to assess the specificity of OMC-2 FIR4, we have extended this study to a sample of sources in low- and intermediate mass. More specifically, we seek to measure the HCO+/N2H+ abundance ratio from high energy lines (J ≥ 6) towards this source sample in order to infer the flux of energetic particles in the warm and dense gas surrounding the protostars.
Methods. We have used observations performed with the Heterodyne Instrument for the Far-Infrared spectrometer on board the Herschel Space Observatory towards a sample of nine protostars.
Results. We report HCO+/N2H+ abundance ratios in the range of five up to 73 towards our source sample. The large error bars do not allow us to conclude whether OMC-2 FIR4 is a peculiar source. Nonetheless, an important result is that the measured HCO+/N2H+ ratio does not vary with the source luminosity. At the present time, OMC-2 FIR4 remains the only source where a high flux of energetic particles is clearly evident. More sensitive and higher angular resolution observations are required to further investigate this process.
Key words: stars: formation / stars: protostars / ISM: molecules / cosmic rays
© ESO, 2017
1. Introduction
Meteoritic materials conserve the traces of a violent past of the early solar system history. Specifically, the derived over-abundance of short-lived radionuclides such as 10Be provides evidence for a strong irradiation (~1019–1020 protons cm-2 in units of fluence) by energetic (≥10–20 MeV) particles (e.g. Gounelle et al. 2013). Various theories have been described in the literature to explain the origin of this energetic particle irradiation: a) galactic cosmic rays anchored to the solar prestellar clump magnetic field and focussed in the solar nebula (e.g. Desch et al. 2004); b) particles accelerated in the atmosphere of the young Sun (Bricker & Caffee 2010); c) particles accelerated at the X-wind intersection (e.g. Gounelle et al. 2006, 2013), and, finally; d) particles accelerated in a dense supersonic protostellar jet (Padovani et al. 2015, 2016).
Unfortunately, it is difficult to distinguish between the above theories, as our own solar system’s irradiation period is now over. If we could observe the process today in forming Sun-like stars, then we might have more constraints to understand what happened to our solar system. To this end, we would need to discover protostellar sources with signatures of energetic particle irradiation. Unfortunately, the direct detection of these energetic particles is impossible. The problem is similar to that of detecting the sources of acceleration of cosmic rays, as the latter are scattered by the galactic magnetic fields and, consequently, have lost the memory of their origin when they arrive on Earth. As for the cosmic ray case, a way forward is to look for signatures of the interaction of the energetic particles with the immediate surrounding material. It turns out that two effects are, in principle, observable: i) an enhanced γ-ray emission, caused by the interaction of ≥280 MeV protons with the H-atoms (e.g. Hayakawa 1952; Stecker et al. 1971); and ii) an enhanced ionization fraction, caused by the interaction of 0.1–1 GeV particles (e.g. Indriolo et al. 2010; Ceccarelli et al. 2011).
In practice, however, for sensitivity reasons, only the second effect is observable in protostars. Also, since the source emitting the energetic particles is, supposedly, embedded in the accreting envelope, one needs to measure the ionization of the gas close to it, namely in the inner warm and dense regions. One way to do this is to observe ions that have directly or indirectly been created by the energetic particles, with relatively high upper level energy transitions, in order to probe the dense and warm gas. Two ions satisfy these two criteria: HCO+ and N2H+. Indeed, both possess rotational transitions in the sub-millimeter with the appropriate upper level energies (≥100 K), and they are created by the reaction of H (an ion that is almost directly created by the energetic particles or X-ray induced secondary electrons) with CO and N2, respectively:
  A first observation of the high lying transitions (with J ≥ 6, namely upper level energy ≥100 K) of HCO+ and N2H+ was obtained by Ceccarelli et al. (2014) towards the protocluster OMC-2 FIR4 (Shimajiri et al. 2008; López-Sepulcre et al. 2013) by HSO (Herschel Space Observatory) within the Key Project CHESS (Ceccarelli et al. 2010). Unexpectedly, the derived HCO+/N2H+ abundance ratio turned out to be very low, 3–4, when compared to that of gas in ‘standard’ conditions (≫10, e.g. Sanhueza et al. 2012; Hoq et al. 2013). When considering the formation (Eqs. (1)and (2)) and destruction routes of both molecules, it turns out that the only way to obtain such a low HCO+/N2H+ abundance ratio is when both molecules are destroyed by electrons, which can only happen when the gas ionization is dominated by i) energetic particles (which is the case of OMC-2 FIR4, see Ceccarelli et al. 2014) or ii) X-ray irradiation (Stäuber et al. 2005), both of which interact with atomic and molecular hydrogen to produce H
 and electrons. Alternatively, a low HCO+/N2H+ abundance ratio can be a result of the depletion of gaseous CO with respect to N2 due to the CO freeze-out. Indeed, the CO gas-phase depletion by adsorption onto grains mantles would then decrease the HCO+ abundance, and likely enhance that of N2H+ (see Sect. 5). However, this occurs only in cold (≤20–25 K) material, which is not the case in OMC-2 FIR4, since the temperature probed by the J ≥ 6 transitions is ≥30 K. Finally, a high abundance of water could also destroy HCO+ and N2H+ (e.g. Stäuber et al. 2006) so that their ratio might decrease (see also Ceccarelli et al. 2014). Again, in the case of OMC-2 FIR4, the observed water abundance is too low for this explanation to be valid. Therefore, the observed low ratio can only be explained by the presence of one or more embedded sources emitting a large flux of energetic particles. Furthermore, the derived dose of energetic particles is similar to that experienced by the young solar system (for further details, see Ceccarelli et al. 2014).
These findings lead one to ask whether OMC-2 FIR4 is a peculiar source or if other protostars do experience the same process. If the latter, what does the process depend on: age, luminosity, mass or multiplicity? In order to address the above questions, we followed up with a survey of the high-J HCO+ and N2H+ HSO observations towards a sample of low- and intermediate-mass embedded protostars. In Sect. 2, we present the observations. Results are presented and discussed in Sects. 3–5, with conclusions set out in Sect. 6.
2. Observations and data reduction
2.1. Source sample
Our survey is composed of a sample of nine well known low- and intermediate-mass embedded protostars that are listed in Table 1 along with their respective coordinates, distances from the Sun, luminosities and LSR velocities. The sources were selected to cover a wide range of luminosities, from 1 L⊙ up to 500 L⊙ (see Table 1), and consequently, likely masses and evolutionary stages.
2.2. Observed frequencies
As we aimed to derive accurate HCO+/N2H+ abundance ratios towards the inner dense and warm region of the envelope surrounding the target sources, high transitions (6 ≤ J ≤ 12) of HCO+ and N2H+ were selected. Furthermore, H13CO+ observations were performed to evaluate HCO+ optical depth. The observed HCO+, H13CO+ and N2H+ frequencies are listed in Table 2 together with the spectroscopic line parameters. Observations of all the targeted lines (see Table 2) have been performed towards our source sample, except for the HCO+ (12–11) transition, which has not been observed towards the following objects: NGC 1333-IRAS2, Serpens-FIRS 1, and NGC 7129-FIRS2.
Selected sources.
Spectroscopic line parameters.
2.3. Herschel HIFI observations
The observations were performed with the Heterodyne Instrument for the Far-Infrared (HIFI) spectrometer (de Graauw et al. 2010) on board the Herschel Space Observatory (Pilbratt et al. 2010) between 2012 April and August as part of a Herschel Open Time. The data were obtained in fast chop dual beam switch (DBS programme) mode pointed towards our sources (see coordinates in Table 1) at a spectral resolution of 1.1 MHz. The HPBW lies in the range 18′′ up to 41′′ (at 1.2 THz and 535 GHz, respectively).
Data were exported to CLASS90 that is part of the GILDAS software1 for reduction and analysis purposes. Calibration uncertainties are estimated to be less than 15% (Roelfsema et al. 2012). The continuum emission was fitted using a first-order polynomial and then subtracted from the scans. Then, the spectra that are reported in this study were – for each source and each targeted line – obtained after “stitching” data from each scan. Also, noting that the line–widths of the observed lines are in the range of 1–4 km s-1 (see Sect. 3), the spectra were smoothed to a spectral resolution of 2.2 MHz. Finally, spectra that are shown in this paper are in units of the main beam temperature (TMB). The intensity conversion from antenna temperature ( ) to main beam temperature was done using the efficiencies (which include the frequency dependency) given by Michael Mueller and Willem Jellema (2014)2.
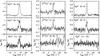 |
Fig. 1 Spectra observed towards Serpens-FIRS 1. Dashed red lines indicate a vLSR = 8.2 km s-1. The name of the observed transition is indicated on each plot. |
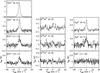 |
Fig. 2 Spectra observed towards IC 1396N. Dashed red lines indicate a vLSR = 0.5 km s-1. The name of the observed transition is indicated on each plot. |
3. Results
In the following (sub)sections, we present and describe in detail the results that were obtained with the HSO/HIFI data.
3.1. Spectra
Figures 1 and 2 show the respective spectra of the HCO+, H13CO+ and N2H+ transitions (see Table 2) observed with Herschel towards the Serpens-FIRS 1 and IC 1396N protostars and, Figs. A.1 to A.7 display the spectra of the other observed sources. For display purposes, the spectra have been smoothed to a spectral resolution of 4.4 MHz. The bulk of the molecular emission appears to peak close to the systemic velocity of the targeted sources (see Table 1). The observed line parameters of the HCO+, H13CO+ and N2H+ transitions towards our survey are summarized in Tables B.1 to B.9. In the following analysis, we have assumed that the molecular emission line is i) clearly detected if the peak intensity is greater than 3σ and the integrated intensity,  dV, is greater than 5σ; ii) “weakly” detected if the peak intensity is lower than the 3σ level but dV ≥ 5σ; and iii) tentatively detected if both the peak intensity and dV are at the 3σ level. The measured integrated line intensities of HCO+, H13CO+ and N2H+ in all the sources are listed in Table 3.
Integrated line intensities of HCO+, H13CO+ and N2H+ towards our source sample.
3.1.1. HCO+
All the targeted HCO+ transitions (see Table 2) are detected towards Serpens-FIRS 1, IC 1396N, NGC 1333-IRAS2, L1641 S3 MMS 1 and NGC 7129-FIRS2. We note that the HCO+ (6–5) transition is the only one detected towards L1527 and L1157-MM. Finally, we only report a detection of the HCO+ (12–11) transitions in direction of the sources L1641 S3 MMS 1 and IC 1396N. Incidentally, it is important to note that the line profile of HCO+ (6–5) appears broadened (e.g. see Fig. 2 towards IC 1396N) by emission from different components within the Herschel beam. In this study, we only focus on the emission arising from the inner dense and warm region of the envelopes surrounding our source sample. We have therefore decomposed the observed profiles into two Gaussians: a broad one and a narrow one. More specifically, we only analysed the emitting gas from the region in which we assume that HCO+ and N2H+ are both co-spatial, namely on the narrow component. Therefore, the present study only reports the parameters associated with this region in its tables and figures.
Beam dilution factor.
3.1.2. H13CO+
The H13CO+ (6–5) transition is detected towards the Serpens-FIRS 1, IC 1396N, VLA1623 and NGC 1333-IRAS2 sources. In addition, we report a detection and tentative detection of H13CO+ (7–6) in the direction of the Serpens-FIRS 1 and IC 1396N intermediate–mass protostars, respectively. Incidentally, we tentatively detect H13CO+ (9–8) towards Serpens-FIRS 1. Finally, we do not detect H13CO+ towards the following five sources: L1527, L1157-MM, L1641 S3 MMS 1, Cep E-mm, and NGC 7129-FIRS2.
3.1.3. N2H+
The N2H+ (6–5) transition is detected towards the following 6 protostars: Serpens-FIRS 1, IC 1396N, VLA1623, NGC 1333-IRAS2, L1641 S3 MMS 1 and NGC 7129-FIRS2 and tentatively detected towards Cep E-mm. We also report the detection of N2H+ (8–7) in the direction of Serpens-FIRS 1 and IC 1396N. The N2H+ (11–10) is tentatively detected towards Serpens-FIRS 1. However, we do not detect N2H+ towards either L1527 and L1157-MM.
To summarize, the main observational results (see Table 3), are as follows:
-
The four HCO+ transitions have been detected in the majority of the sources, with the lowest transition, J = 6–5, detected in all of them.
-
On the contrary, the H13CO+ lines are mostly undetected, with even the J = 6–5 line detected in only four out of the nine sources.
-
Finally, the N2H+J = 6–5 line was detected in seven out the nine sources and the J = 8–7 in only two of them.
3.2. Spectral line energy distribution (SLED) of HCO+
The sources observed in the present study lie at different distance from the Sun (see Table 1). Beam dilution not only depends on the source size of the emitting region but in addition depends on the distance of the source. Under the assumption of an emitting region of 0.05 pc for each source, we can define the beam dilution factor, B , as follows (Goldsmith & Langer 1999):  (3)where d is the distance from the Sun (pc) and θb the Herschel beam (′′) , respectively. For each source, the respective derived B factor (see Table 4) was used to correct for beam dilution the integrated line intensity of the HCO+ lines.
Figure 3 shows the observed spectral line energy distribution (SLED) of HCO+, corrected for beam dilution, as a function of the upper J transition towards all sources. Table 5 gives the measured integrated line intensity ratios, HCO+ (6–5) / HCO+ (8–7), towards our survey. It is immediately apparent that the HCO+(6 − 5) / (8 − 7) line ratio suggests two classes of sources. Indeed, in VLA1623, IC 1396N and perhaps Cep E-mm, this ratio is about three, whereas it is closer to unity (within the error bars) towards the other sources. This finding strongly suggests that the gas is warmer and denser in the latter group of sources. Nonetheless, a caveat of this approach is related to the opacities of the HCO+(8 − 7) lines. Here, we have assumed that the emission is optically thin. However, if τHCO+(8 − 7) ≫ 1, the gas probed towards VLA1623 and IC 1396N could be warmer.
Unfortunately, given the reduced number of detected lines in each source, we could not carry out an LVG analysis to constrain the density and temperature of the emitting gas, as was done in Ceccarelli et al. (2014) for OMC-2 FIR4.
Measured integrated line intensity HCO+ (6–5)/HCO+ (8–7) ratios towards our source sample.
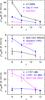 |
Fig. 3 SLED of HCO+ as a function of the upper J transition towards the observed sources (see Table 1). The name of the source is indicated in each panel. |
4. HCO+/N2H+ abundance ratio determination
As explained in the Introduction, the goal of this article is to measure the HCO+/N2H+ abundance ratio towards our sample of low-mass and intermediate-mass sources in order to infer the flux of energetic particles in the interior of the protostar envelopes. To derive this ratio, we used the integrated line intensity ratio of the HCO+ (6–5) and N2H+ (6–5) lines, which are the main lines detected in the majority of the sources (see Table 3). This approach relies on the assumption that HCO+ emits from the same region as N2H+. As these (J = 6–5) transitions probe warm and dense gas and are chemically similar, this assumption is likely correct. More specifically, in the following sections, we obtain a robust estimate from the HCO+ (6–5) over N2H+ (6–5) line intensity ratio towards each observed source. In addition, it is important to note that the measured integrated line intensity ratios do not suffer from beam dilution effect because the two targeted transitions have similar line frequencies and have been observed within the same beam. Thus, since the two transitions have similar critical density and upper level energy (see Table 2), the intensity ratio conversion to an abundance ratio only assumes that the two species are co-existing in the telescope beam, once the ratio is corrected for the line opacity (see below). As a consequence, the obtained ratio represents an upper limit to the lowest HCO+/N2H+ abundance ratio in the region.
4.1. Line opacity
As stated above, the HCO+ abundance relative to N2H+ depends on the optical depth. The observations of the H13CO+ lines, allow us to estimate the optical depth of the HCO+ lines. To this end, we compared the integrated intensity of HCO+ (6–5) to that of H13CO+ (6–5), when available (see Sect. 3.1.2 and Tables 3, and B.1 to B.9). From that, we estimated a flux ratio of 22, 16, 9 and 32 towards the VLA1623, NGC 1333–IRAS2, Serpens–FIRS 1 and IC 1396N protostars, respectively. Thus, if we assume an isotopic ratio of 12C/13C = 68 for the local ISM (see Milam et al. 2005), the HCO+ (6–5) line is optically thick in all these sources, with τ lying in the range approximately two up to eight (see Table 6).
Regarding N2H+, it is important to state that our analysis hinges upon the assumption that the N2H+ (6–5) emission is optically thin. However, if τN2H+ ≫ 1, the derived HCO+/N2H+ abundance ratio should be an upper limit for the true HCO+/N2H abundance. In that instance, the true HCO+/N2H ratio would be smaller than the one reported in our study.
Measured integrated line intensity HCO+ (6–5)/N2H+ (6–5) ratios towards our source sample.
4.2. HCO+/N2H+ abundance ratio
Figure 4 shows the distribution of the HCO+/N2H+ (6–5) ratios, corrected for the HCO+ line opacity when available (see Table 6), that we derived towards our source sample. More specifically, the reported HCO+/N2H+ abundance ratios for VLA1623, NGC 1333–IRAS2, Serpens–FIRS 1 and IC 1396N are based on integrated line intensity ratios of the H13CO+ (6–5) over N2H+ (6–5), and assuming an isotopic 12C/13C ratio of 68 (see Milam et al. 2005). Regarding L1641 S3 MMS 1, Cep E–mm and NGC 7129–FIRS2 protostars, the measured abundance ratio is only based on the ratio between the integrated line intensity of the HCO+ (6–5) and N2H+ (6–5) transitions. In the case of τ ≫ 1, we estimated an upper limit of the HCO+/N2H+ ratio (which is based on the upper limit of the  dV, see Table 3) for these three sources and included it in the error bars displayed in Fig. 4. We note that the derived abundance ratios are given (Fig. 4 and Table 6) sorting the source by increasing luminosities and lie in the range of 4
 up to 42
 .
.
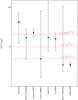 |
Fig. 4 Distribution of the HCO+/N2H+ abundance ratios towards our source sample (see Table 1). The sources are sorted by increasing luminosities. Full dots with error bars indicate the abundance ratios that have been corrected for the line opacity when H13CO+ (6–5) observations are available (see Sects. 4.1 and 4.2). Red circle marks the colder source of our sample (based on the HCO+ SLED, see Sect. 3.2). The blue filled square shows the HCO+/N2H+ ratio reported in direction of OMC-2 FIR4 by Ceccarelli et al. (2014). Finally, the red dashed lines show the predicted ratios that are expected for cosmic-rate ionization rates, ζ, of 10-14 s-1, 10-15 s-1 and 3 × 10-17 s-1, for a gas temperature of 40 K and a nH2 density of 2.5 × 105 cm-3 (for further details see Ceccarelli et al. 2014). |
5. Discussion
Numerous studies have investigated the HCO+/N2H+ abundance ratio towards different astrophysical environments (e.g. Turner & Thaddeus 1977; Snyder et al. 1977; Kim et al. 2006; Lo et al. 2009; Meier & Turner 2012; Sanhueza et al. 2012; Ren et al. 2014; Stephens et al. 2015, and references therein). The latter is subject to variation according to the density of the region along with its chemical content (i.e. CO) and evolutionary stage.
In particular, the HCO+/N2H+ ratio is expected and measured to be low in early stages of star formation (T< 10 K). This results from the adsorption of CO onto grain mantles at low temperature. In that instance, N2H+ is unlikely to be destroyed by CO, as suggested by Eq. (4) (Bergin & Langer 1997):  (4)On the contrary, in a more evolved stage, when CO is released in the gas phase (typically T> 20 K), the HCO+/N2H+ ratio is expected to be large, since the destruction of N2H+ by CO leads to an enhancement in HCO+ (see Eq. (4) and Bergin & Langer 1997). Alternatively, the HCO+/N2H+ ratio might be affected by the CO and N2 abundances. On the one hand, the CO abundance may be lower that the canonical value of 10-4: in protostellar envelopes (Alonso-Albi et al. 2010), low-mass protostars (Yıldız et al. 2010; Anderl et al. 2016) and, protoplanetary disk (e.g. Favre et al. 2013). On the other hand, N2 may not be the main nitrogen reservoir, nitrogen being in the atomic-form and/or in ammonia ices (e.g Le Gal et al. 2014, and references therein). Finally, cosmic rays and X-rays might also impact this ratio (Ceccarelli et al. 2014; Bruderer et al. 2009), free electrons destroying both HCO+ and N2H+. Indeed, Ceccarelli et al. (2014) have shown that CR-like energetic particles (cosmic-ray ionization rate ζ> 10-14 s-1) can explain the very low and unusual HCO+/N2H+ abundance ratio of about three to four that is observed towards the proto-cluster OMC-2 FIR4. Incidentally, Podio et al. (2014) have also shown that a high value of the cosmic-ray ionization rate (ζ ~ 3 × 10-16 s-1) reproduces the observed HCO+ and N2H+ abundances towards a young protostellar outflow shock. As a matter of fact, X-rays may add up with cosmic rays in the production of H
 and free electrons, provided that the X-ray ionisation rate is high enough, which is not the case here, as most of our source sample does not show significant X-ray emission (see Furusho et al. 2000, and the Chandra Data Archive). Figure 5 illustrates and summarizes the main chemical HCO+ and N2H+ destruction and formation pathways.
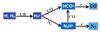 |
Fig. 5 Sketch of reactions that form and destroy HCO+ and N2H+: when electrons do not dominate, CO is the main destroyer of N2H+. However, note that there are other branching ratios which give less abundant products that are not shown in this sketch. |
In that context, in Fig. 4, we compare the value derived towards OMC-2 FIR4 with the ones derived from our study. In addition, we also report in Fig. 4 HCO+/N2H+ ratios of 5, 10, and 21 that are predicted by the model of Ceccarelli et al. (2014) for a gas temperature of 40 K and a nH2 density of 2.5 × 105 cm-3, which are reasonable values for the gas probed by the Herschel observations presented in this work and, for a cosmic-ray ionization rate, ζ, of 10-14 s-1, 10-15 s-1 and 3 × 10-17 s-1, respectively. Higher HCO+/N2H+ ratios (for example a value of 30) would correspond to lower ζ and conversely, lower HCO+/N2H+ ratios would correspond to higher ζ. We note that the case of L1641 S3 MMS 1 is interesting as the region where this source is lying contains X-ray sources (see Pillitteri et al. 2013) which may contribute to the ionization rate. Unfortunately, the error bars in our sample are relatively large and do not allow to draw firm conclusions on enhanced ζ of X-rays in any source. On the contrary, VLA1623, Serpens-FIRS 1, IC 1396N and CepE do not show evident signs of large ζ. This result comes as no surprise in the case of VLA1623 and IC 1396N, since their HCO+ SLEDs (see Fig. 3) are strongly suggesting cold sources. Nevertheless, one notable feature of Fig. 4 is that the observed HCO+/N2H+ ratio does not increase or decrease with increasing luminosity.
We conclude that, at the present time, OMC-2 FIR4 is the only source where a high flux of energetic particles is clearly evident. Unfortunately, the statistics are not sufficient for us to infer what makes OMC-2 FIR4 special in that respect. More sensitive observations, especially towards NGC 7129-FIRS2 and L1641 S3 MMS 1 (see pattern of the HCO+ SLED along with the obtained HCO+/N2H+ ratio in Figs. 3 and 4), and in a much larger sample are necessary to say more.
6. Conclusions
We have investigated the HCO+/N2H+ abundance ratio towards a sample of low- and intermediate-mass protostars, through observations performed with the HIFI instrument on board the Herschel Space Observatory. Our study is based on the analysis of high J transitions (6 ≤ J ≤ 12) of the HCO+, N2H+ and H13CO+ ions.
All the targeted HCO+ transitions have been detected in the majority of the sources. More specifically, the lowest lying transition (6–5) is detected towards all the nine surveyed sources for HCO+ and, in seven of them for N2H+. Regarding H13CO+, the (6–5) line is only detected towards four out of the nine sources. Assuming a 12C/13C isotopic ratio of 68, we report a HCO+/N2H+ abundance ratio in the range of 4 up to 42. The latter might even be lower depending on the opacity of the N2H+ (6–5) transition. Incidentally, a salient result is that the measured HCO+/N2H+ ratio does not increase or decrease with increasing luminosity, which suggests that UV radiation does not play a major role in the HCO+/N2H+ abundance ratio. However, our measurements have large error bars that prevent us from determining whether OMC-2 FIR4 is the only source where a high flux of energetic particles is observed. Therefore, further sensitive and high angular resolution observations towards a much larger source sample are necessary i) to ascertain whether OMC-2 FIR4 is a peculiar source; and ii) to accurately infer the flux of energetic particles at the interior of the protostar envelopes if applicable.
Acknowledgments
Support for this work was provided by the French space agency CNES. M.P. acknowledges funding from the European Unions Horizon 2020 research and innovation programme under the Marie Skłodowska-Curie grant agreement No. 664931. Support for this work was also provided by NASA (Herschel OT funding) through an award issued by JPL/Caltech. This paper makes use of Herschel/HIFI data. Herschel is an ESA space observatory with science instruments provided by European-led principal Investigator consortia and with important participation from NASA. HIFI has been designed and built by a consortium of institutes and university departments from across Europe, Canada, and the United States under the leadership of SRON Netherlands Institute for Space Research, Groningen, The Netherlands and with major contributions from Germany, France, and the U.S. Consortium members are: Canada: CSA, U. Waterloo; France: CESR, LAB, LERMA, IRAM; Germany: KOSMA, MPIfR, MPS; Ireland: NUI Maynooth; Italy: ASI, IFSI-INAF, Osservatorio Astrofisico di Arcetri-INAF; Netherlands: SRON, TUD; Poland: CAMK, CBK; Spain: Observatorio Astronómico Nacional (IGN), Centro de Astrobiología (CSIC-INTA); Sweden: Chalmers University of Technology-MC2, RSS and GARD, Onsala Space Observatory, Swedish National Space Board, Stockholm Observatory; Switzerland: ETH Zurich, FHNW; USA: Caltech, JPL, NHSC. Finally, we thank the anonymous referee for helpful comments and suggestions.
References
- Alonso-Albi, T., Fuente, A., Crimier, N., et al. 2010, A&A, 518, A52 [NASA ADS] [CrossRef] [EDP Sciences] [Google Scholar]
- Amano, T., Hirao, T., & Takano, J. 2005, J. Mol. Spectrosc., 234, 170 [Google Scholar]
- Anderl, S., Maret, S., Cabrit, S., et al. 2016, A&A, 591, A3 [NASA ADS] [CrossRef] [EDP Sciences] [Google Scholar]
- Andre, P., Ward-Thompson, D., & Barsony, M. 1993, ApJ, 406, 122 [NASA ADS] [CrossRef] [Google Scholar]
- Bergin, E. A., & Langer, W. D. 1997, ApJ, 486, 316 [NASA ADS] [CrossRef] [Google Scholar]
- Botschwina, P., Horn, M., Flugge, J., & Seeger, S. 1993, J. Chem. Soc., 89, 2219 [Google Scholar]
- Bricker, G. E., & Caffee, M. W. 2010, ApJ, 725, 443 [NASA ADS] [CrossRef] [Google Scholar]
- Bruderer, S., Doty, S. D., & Benz, A. O. 2009, ApJS, 183, 179 [NASA ADS] [CrossRef] [Google Scholar]
- Caselli, P., Myers, P. C., & Thaddeus, P. 1995, ApJ, 455, L77 [NASA ADS] [CrossRef] [Google Scholar]
- Ceccarelli, C., Bacmann, A., Boogert, A., et al. 2010, A&A, 521, L22 [NASA ADS] [CrossRef] [EDP Sciences] [Google Scholar]
- Ceccarelli, C., Hily-Blant, P., Montmerle, T., et al. 2011, ApJ, 740, L4 [NASA ADS] [CrossRef] [Google Scholar]
- Ceccarelli, C., Dominik, C., López-Sepulcre, A., et al. 2014, ApJ, 790, L1 [NASA ADS] [CrossRef] [Google Scholar]
- Cernis, K. 1990, Ap&SS, 166, 315 [NASA ADS] [CrossRef] [Google Scholar]
- Crimier, N., Ceccarelli, C., Alonso-Albi, T., et al. 2010, A&A, 516, A102 [NASA ADS] [CrossRef] [EDP Sciences] [Google Scholar]
- Davies, P. B., & Rothwell, W. J. 1984, J. Chem. Phys., 81, 5239 [NASA ADS] [CrossRef] [Google Scholar]
- de Graauw, T., Helmich, F. P., Phillips, T. G., et al. 2010, A&A, 518, L6 [NASA ADS] [CrossRef] [EDP Sciences] [Google Scholar]
- Desch, S. J., Connolly, Jr., H. C., & Srinivasan, G. 2004, ApJ, 602, 528 [NASA ADS] [CrossRef] [MathSciNet] [Google Scholar]
- Favre, C., Cleeves, L. I., Bergin, E. A., Qi, C., & Blake, G. A. 2013, ApJ, 776, L38 [NASA ADS] [CrossRef] [Google Scholar]
- Giannini, T., Nisini, B., & Lorenzetti, D. 2001, ApJ, 555, 40 [NASA ADS] [CrossRef] [Google Scholar]
- Goldsmith, P. F., & Langer, W. D. 1999, ApJ, 517, 209 [NASA ADS] [CrossRef] [Google Scholar]
- Gounelle, M., Shu, F. H., Shang, H., et al. 2006, ApJ, 640, 1163 [NASA ADS] [CrossRef] [Google Scholar]
- Gounelle, M., Chaussidon, M., & Rollion-Bard, C. 2013, ApJ, 763, L33 [NASA ADS] [CrossRef] [Google Scholar]
- Gregersen, E. M., & Evans, II, N. J. 2001, ApJ, 553, 1042 [NASA ADS] [CrossRef] [Google Scholar]
- Havenith, M., Zwart, E., Leo Meerts, W., & Ter Meulen, J. J. 1990, J. Chem. Phys., 93, 8446 [NASA ADS] [CrossRef] [Google Scholar]
- Hayakawa, S. 1952, Prog. Theor. Phys., 8, 571 [NASA ADS] [CrossRef] [Google Scholar]
- Hirota, E., & Endo, Y. 1988, J. Mol. Spectrosc., 127, 527 [Google Scholar]
- Hoq, S., Jackson, J. M., Foster, J. B., et al. 2013, ApJ, 777, 157 [NASA ADS] [CrossRef] [Google Scholar]
- Indriolo, N., Blake, G. A., Goto, M., et al. 2010, ApJ, 724, 1357 [NASA ADS] [CrossRef] [Google Scholar]
- Jørgensen, J. K., Hogerheijde, M. R., van Dishoeck, E. F., Blake, G. A., & Schöier, F. L. 2004, A&A, 413, 993 [NASA ADS] [CrossRef] [EDP Sciences] [Google Scholar]
- Jørgensen, J. K., Bourke, T. L., Myers, P. C., et al. 2007, ApJ, 659, 479 [NASA ADS] [CrossRef] [Google Scholar]
- Karska, A., Herczeg, G. J., van Dishoeck, E. F., et al. 2013, A&A, 552, A141 [NASA ADS] [CrossRef] [EDP Sciences] [Google Scholar]
- Kawaguchi, K., Yamada, C., Saito, S., & Hirota, E. 1985, J. Chem. Phys., 82, 1750 [NASA ADS] [CrossRef] [Google Scholar]
- Kim, S.-J., Kim, H.-D., Lee, Y., et al. 2006, ApJS, 162, 161 [NASA ADS] [CrossRef] [Google Scholar]
- Kristensen, L. E., van Dishoeck, E. F., Bergin, E. A., et al. 2012, A&A, 542, A8 [NASA ADS] [CrossRef] [EDP Sciences] [Google Scholar]
- Lattanzi, V., Walters, A., Drouin, B. J., & Pearson, J. C. 2007, ApJ, 662, 771 [NASA ADS] [CrossRef] [Google Scholar]
- Le Gal, R., Hily-Blant, P., Faure, A., et al. 2014, A&A, 562, A83 [NASA ADS] [CrossRef] [EDP Sciences] [Google Scholar]
- Lo, N., Cunningham, M. R., Jones, P. A., et al. 2009, MNRAS, 395, 1021 [NASA ADS] [CrossRef] [Google Scholar]
- Loinard, L., Torres, R. M., Mioduszewski, A. J., & Rodríguez, L. F. 2008, ApJ, 675, L29 [NASA ADS] [CrossRef] [Google Scholar]
- López-Sepulcre, A., Taquet, V., Sánchez-Monge, Á., et al. 2013, A&A, 556, A62 [NASA ADS] [CrossRef] [EDP Sciences] [Google Scholar]
- López-Sepulcre, A., Jaber, A. A., Mendoza, E., et al. 2015, MNRAS, 449, 2438 [NASA ADS] [CrossRef] [Google Scholar]
- Maury, A., Ohashi, N., & André, P. 2012, A&A, 539, A130 [NASA ADS] [CrossRef] [EDP Sciences] [Google Scholar]
- Meier, D. S., & Turner, J. L. 2012, ApJ, 755, 104 [NASA ADS] [CrossRef] [Google Scholar]
- Milam, S. N., Savage, C., Brewster, M. A., Ziurys, L. M., & Wyckoff, S. 2005, ApJ, 634, 1126 [NASA ADS] [CrossRef] [Google Scholar]
- Müller, H. S. P., Schlöder, F., Stutzki, J., & Winnewisser, G. 2005, J. Mol. Struct., 742, 215 [NASA ADS] [CrossRef] [Google Scholar]
- Padovani, M., Hennebelle, P., Marcowith, A., & Ferrière, K. 2015, A&A, 582, L13 [NASA ADS] [CrossRef] [EDP Sciences] [Google Scholar]
- Padovani, M., Marcowith, A., Hennebelle, P., & Ferrière, K. 2016, A&A, 590, A8 [NASA ADS] [CrossRef] [EDP Sciences] [Google Scholar]
- Pagani, L., Daniel, F., & Dubernet, M.-L. 2009, A&A, 494, 719 [NASA ADS] [CrossRef] [EDP Sciences] [Google Scholar]
- Pilbratt, G. L., Riedinger, J. R., Passvogel, T., et al. 2010, A&A, 518, L1 [CrossRef] [EDP Sciences] [Google Scholar]
- Podio, L., Lefloch, B., Ceccarelli, C., Codella, C., & Bachiller, R. 2014, A&A, 565, A64 [NASA ADS] [CrossRef] [EDP Sciences] [Google Scholar]
- Remijan, A. J., Markwick-Kemper, A., & ALMA Working Group on Spectral Line Frequencies 2007, BAAS, 38, 963 [NASA ADS] [Google Scholar]
- Ren, Z., Li, D., & Chapman, N. 2014, ApJ, 788, 172 [NASA ADS] [CrossRef] [Google Scholar]
- Roelfsema, P. R., Helmich, F. P., Teyssier, D., et al. 2012, A&A, 537, A17 [NASA ADS] [CrossRef] [EDP Sciences] [Google Scholar]
- Sanhueza, P., Jackson, J. M., Foster, J. B., et al. 2012, ApJ, 756, 60 [NASA ADS] [CrossRef] [Google Scholar]
- Schmid-Burgk, J., Muders, D., Müller, H. S. P., & Brupbacher-Gatehouse, B. 2004, A&A, 419, 949 [NASA ADS] [CrossRef] [EDP Sciences] [Google Scholar]
- Shimajiri, Y., Takahashi, S., Takakuwa, S., Saito, M., & Kawabe, R. 2008, ApJ, 683, 255 [NASA ADS] [CrossRef] [Google Scholar]
- Snyder, L. E., Hollis, J. M., & Watson, W. D. 1977, ApJ, 212, 79 [NASA ADS] [CrossRef] [Google Scholar]
- Stäuber, P., Doty, S. D., van Dishoeck, E. F., & Benz, A. O. 2005, A&A, 440, 949 [NASA ADS] [CrossRef] [EDP Sciences] [Google Scholar]
- Stäuber, P., Jørgensen, J. K., van Dishoeck, E. F., Doty, S. D., & Benz, A. O. 2006, A&A, 453, 555 [NASA ADS] [CrossRef] [EDP Sciences] [Google Scholar]
- Stecker, F. W., Vette, J. I., & Trombka, J. I. 1971, Nat. Phys. Sci., 231, 122 [NASA ADS] [CrossRef] [Google Scholar]
- Stephens, I. W., Jackson, J. M., Sanhueza, P., et al. 2015, ApJ, 802, 6 [NASA ADS] [CrossRef] [Google Scholar]
- Straizys, V., Cernis, K., Kazlauskas, A., & Meistas, E. 1992, Balt. Astron., 1, 149 [NASA ADS] [Google Scholar]
- Tinti, F., Bizzocchi, L., Degli Esposti, C., & Dore, L. 2007, ApJ, 669, L113 [NASA ADS] [CrossRef] [Google Scholar]
- Turner, B. E., & Thaddeus, P. 1977, ApJ, 211, 755 [NASA ADS] [CrossRef] [Google Scholar]
- Verhoeve, P., Zwart, E., Versluis, M., et al. 1990, Rev. Sci. Instrum., 61, 1612 [NASA ADS] [CrossRef] [Google Scholar]
- Yıldız, U. A., van Dishoeck, E. F., Kristensen, L. E., et al. 2010, A&A, 521, L40 [NASA ADS] [CrossRef] [EDP Sciences] [Google Scholar]
Appendix A: HCO+, H13CO+ and N2H+ towards our sample of intermediate and low-mass protostars
Figures A.1 to A.7 display the respective spectra of the HCO+, H13CO+ and N2H+ transitions observed with Herschel towards a portion of our source sample (see Sect. 3). Note that for display purposes, the spectra have been smoothed at a spectral resolution of 4.4 MHz.
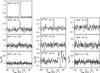 |
Fig. A.1 Spectra observed towards VLA1623. Dashed red lines indicate a vLSR = 3.8 km s-1. The observed transition is indicated on each plot. |
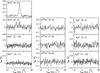 |
Fig. A.2 Spectra observed towards L1527. Dashed red lines indicate a vLSR = 5.4 km s-1. The observed transition is indicated on each plot. |
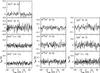 |
Fig. A.3 Spectra observed towards L1157–MM. Dashed red lines indicate a vLSR = 2.4 km s-1. The observed transition is indicated on each plot. |
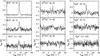 |
Fig. A.4 Spectra observed towards NGC 1333–IRAS2. Dashed red lines indicate a vLSR = 7.45 km s-1. The observed transition is indicated on each plot. |
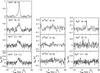 |
Fig. A.5 Spectra observed towards L1641 S3 MMS 1. Dashed red lines indicate a vLSR = 5.0 km s-1. The observed transition is indicated on each plot. |
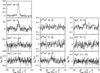 |
Fig. A.6 Spectra observed towards Cep E–mm. Dashed red lines indicate a vLSR = −11.0 km s-1. The observed transition is indicated on each plot. |
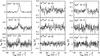 |
Fig. A.7 Spectra observed towards NGC 7129–FIRS2. Dashed red lines indicate a vLSR = −9.7 km s-1. The observed transition is indicated on each plot. |
Appendix B: Transitions of HCO+, H13CO+ and N2H+ observed with Herschel towards our sample of intermediate and low-mass protostars
Tables B.1 to B.9 summarize the line parameters for all the HCO+, H13CO+ and N2H+ transitions observed with Herschel towards our source sample (see Sect. 3).
Line parameters for the HCO+, H13CO+ and N2H+ transitions observed towards Serpens–FIRS 1.
Line parameters for the HCO+, H13CO+ and N2H+ transitions observed towards IC 1396N.
Line parameters for the HCO+, H13CO+ and N2H+ transitions observed towards VLA1623.
Line parameters for the HCO+, H13CO+ and N2H+ transitions observed towards L1527.
Line parameters for the HCO+, H13CO+ and N2H+ transitions observed towards L1157–MM.
Line parameters for the HCO+, H13CO+ and N2H+ transitions observed towards NGC 1333–IRAS2.
Line parameters for the HCO+, H13CO+ and N2H+ transitions observed towards L1641 S3 MMS 1.
Line parameters for the HCO+, H13CO+ and N2H+ transitions observed towards Cep E–mm.
Line parameters for the HCO+, H13CO+ and N2H+ transitions observed towards NGC 7129–FIRS2.
All Tables
Measured integrated line intensity HCO+ (6–5)/HCO+ (8–7) ratios towards our source sample.
Measured integrated line intensity HCO+ (6–5)/N2H+ (6–5) ratios towards our source sample.
Line parameters for the HCO+, H13CO+ and N2H+ transitions observed towards Serpens–FIRS 1.
Line parameters for the HCO+, H13CO+ and N2H+ transitions observed towards IC 1396N.
Line parameters for the HCO+, H13CO+ and N2H+ transitions observed towards VLA1623.
Line parameters for the HCO+, H13CO+ and N2H+ transitions observed towards L1527.
Line parameters for the HCO+, H13CO+ and N2H+ transitions observed towards L1157–MM.
Line parameters for the HCO+, H13CO+ and N2H+ transitions observed towards NGC 1333–IRAS2.
Line parameters for the HCO+, H13CO+ and N2H+ transitions observed towards L1641 S3 MMS 1.
Line parameters for the HCO+, H13CO+ and N2H+ transitions observed towards Cep E–mm.
Line parameters for the HCO+, H13CO+ and N2H+ transitions observed towards NGC 7129–FIRS2.
All Figures
|
Fig. 1 Spectra observed towards Serpens-FIRS 1. Dashed red lines indicate a vLSR = 8.2 km s-1. The name of the observed transition is indicated on each plot. |
| In the text | |
|
Fig. 2 Spectra observed towards IC 1396N. Dashed red lines indicate a vLSR = 0.5 km s-1. The name of the observed transition is indicated on each plot. |
| In the text | |
|
Fig. 3 SLED of HCO+ as a function of the upper J transition towards the observed sources (see Table 1). The name of the source is indicated in each panel. |
| In the text | |
|
Fig. 4 Distribution of the HCO+/N2H+ abundance ratios towards our source sample (see Table 1). The sources are sorted by increasing luminosities. Full dots with error bars indicate the abundance ratios that have been corrected for the line opacity when H13CO+ (6–5) observations are available (see Sects. 4.1 and 4.2). Red circle marks the colder source of our sample (based on the HCO+ SLED, see Sect. 3.2). The blue filled square shows the HCO+/N2H+ ratio reported in direction of OMC-2 FIR4 by Ceccarelli et al. (2014). Finally, the red dashed lines show the predicted ratios that are expected for cosmic-rate ionization rates, ζ, of 10-14 s-1, 10-15 s-1 and 3 × 10-17 s-1, for a gas temperature of 40 K and a nH2 density of 2.5 × 105 cm-3 (for further details see Ceccarelli et al. 2014). |
| In the text | |
|
Fig. 5 Sketch of reactions that form and destroy HCO+ and N2H+: when electrons do not dominate, CO is the main destroyer of N2H+. However, note that there are other branching ratios which give less abundant products that are not shown in this sketch. |
| In the text | |
|
Fig. A.1 Spectra observed towards VLA1623. Dashed red lines indicate a vLSR = 3.8 km s-1. The observed transition is indicated on each plot. |
| In the text | |
|
Fig. A.2 Spectra observed towards L1527. Dashed red lines indicate a vLSR = 5.4 km s-1. The observed transition is indicated on each plot. |
| In the text | |
|
Fig. A.3 Spectra observed towards L1157–MM. Dashed red lines indicate a vLSR = 2.4 km s-1. The observed transition is indicated on each plot. |
| In the text | |
|
Fig. A.4 Spectra observed towards NGC 1333–IRAS2. Dashed red lines indicate a vLSR = 7.45 km s-1. The observed transition is indicated on each plot. |
| In the text | |
|
Fig. A.5 Spectra observed towards L1641 S3 MMS 1. Dashed red lines indicate a vLSR = 5.0 km s-1. The observed transition is indicated on each plot. |
| In the text | |
|
Fig. A.6 Spectra observed towards Cep E–mm. Dashed red lines indicate a vLSR = −11.0 km s-1. The observed transition is indicated on each plot. |
| In the text | |
|
Fig. A.7 Spectra observed towards NGC 7129–FIRS2. Dashed red lines indicate a vLSR = −9.7 km s-1. The observed transition is indicated on each plot. |
| In the text | |
Current usage metrics show cumulative count of Article Views (full-text article views including HTML views, PDF and ePub downloads, according to the available data) and Abstracts Views on Vision4Press platform.
Data correspond to usage on the plateform after 2015. The current usage metrics is available 48-96 hours after online publication and is updated daily on week days.
Initial download of the metrics may take a while.