Fig. 7
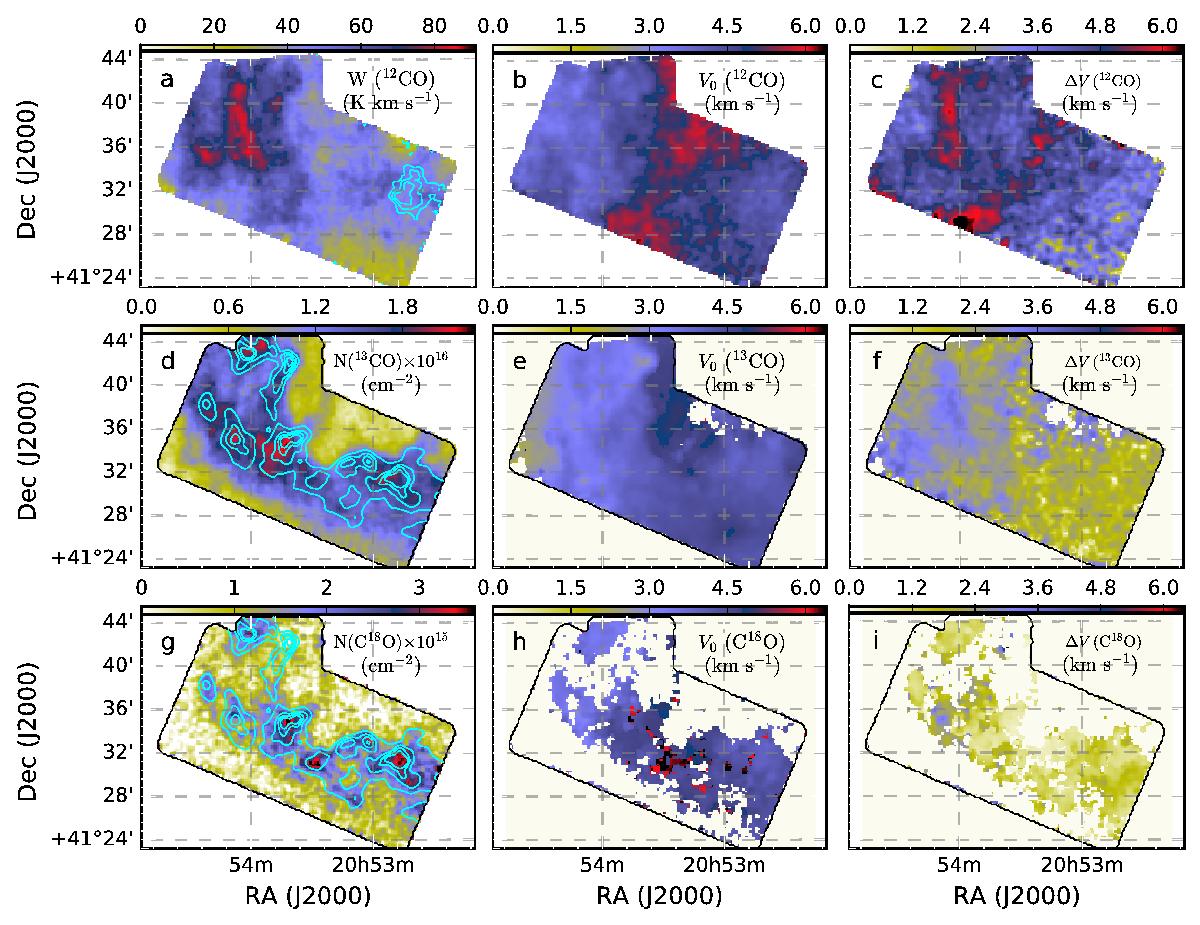
First row: total integrated intensity (K km s-1) of 12CO, velocity and line width at FWHM (km s-1) obtained from the Gaussian fit of the 12CO line. Second and third rows: total column densities and best-fit values for velocity and line width obtained from the Gaussian fit of the 13CO and C18O lines, respectively. The column densities are derived with a constant excitation temperature of 15 K. The contour in the W(12CO) map shows the observed 12CO emission in the range of [−4,−1 ] km s-1 which was not included in our analysis. The lowest contour is at 0.7 K km s-1 and the contours increase with 0.7 K km s-1 steps. The contours in the 13CO and C18O column density maps correspond to 45%, 60%, 75%, and 90% of the maximum value of τ250. We have masked regions with S/N < 3 in the velocity and line width maps of 13CO and C18O.
Current usage metrics show cumulative count of Article Views (full-text article views including HTML views, PDF and ePub downloads, according to the available data) and Abstracts Views on Vision4Press platform.
Data correspond to usage on the plateform after 2015. The current usage metrics is available 48-96 hours after online publication and is updated daily on week days.
Initial download of the metrics may take a while.