Fig. 6
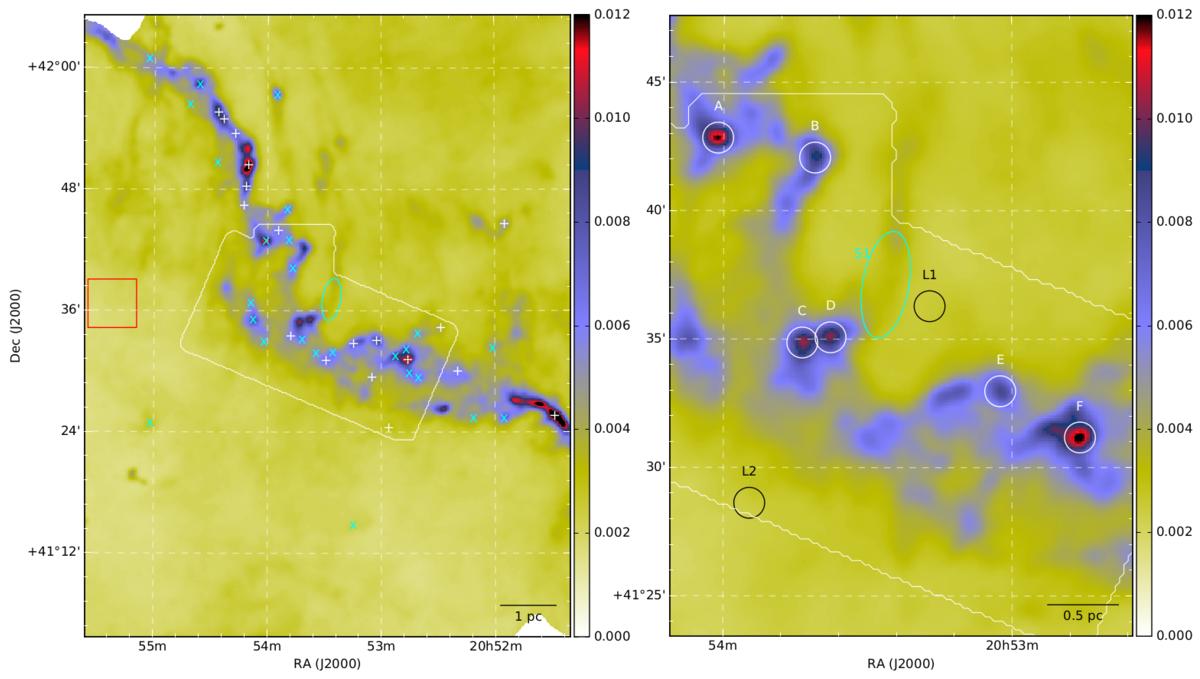
Left panel: optical depth map of 250 μm derived from the Herschel observations, the white plus signs indicate starless cores and the cyan crosses indicate protostellar source candidates identified by Montillaud et al. (2015); and right panel: clumps (labelled A to F) chosen for the spectral analysis (Figs. 14 and 15). The labels L1 and L2 indicate the positions where we have extracted spectra to analyse the warm filament (Fig. D.1). The white outline in the panels corresponds to the area of the Nobeyama observations. The cyan ellipse marks the selected striation S1, and the red rectangle marks the area used for the background subtraction as discussed in Sect. 3.4.
Current usage metrics show cumulative count of Article Views (full-text article views including HTML views, PDF and ePub downloads, according to the available data) and Abstracts Views on Vision4Press platform.
Data correspond to usage on the plateform after 2015. The current usage metrics is available 48-96 hours after online publication and is updated daily on week days.
Initial download of the metrics may take a while.