Free Access
Fig. 3
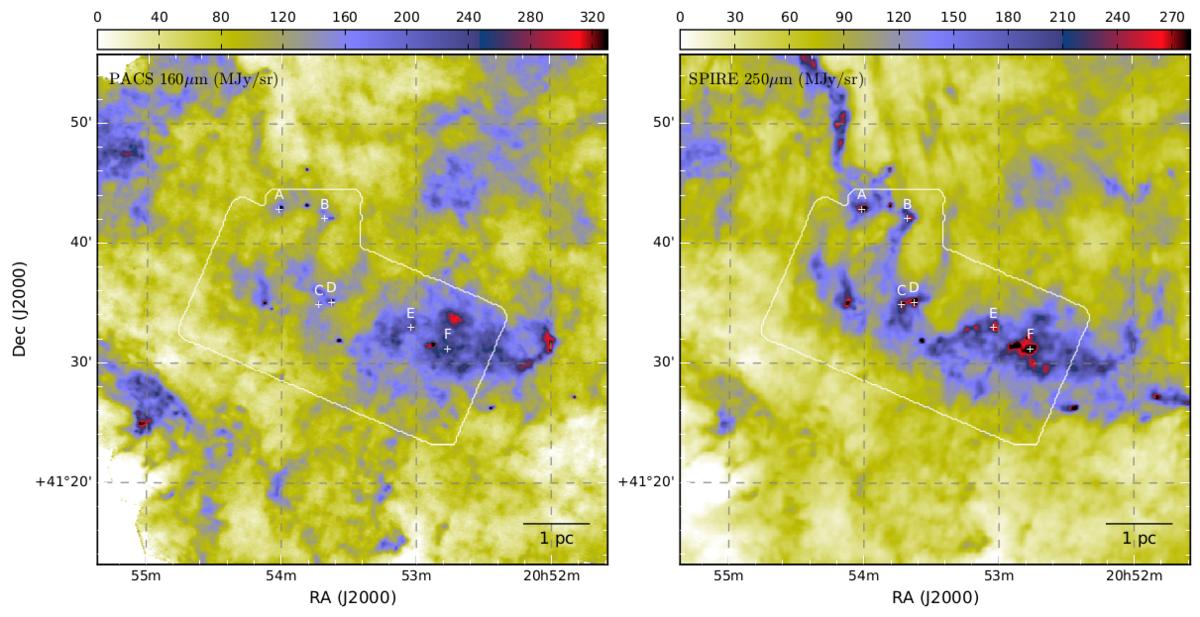
Surface brightness observed by Herschel: PACS 160 μm map (left), and SPIRE 250 μm map (right). The labels from A to F and the white crosses show the locations of cold clumps analysed in Sect. 3. The white contour shows the area covered by our line observations from the Nobeyama 45 m telescope.
Current usage metrics show cumulative count of Article Views (full-text article views including HTML views, PDF and ePub downloads, according to the available data) and Abstracts Views on Vision4Press platform.
Data correspond to usage on the plateform after 2015. The current usage metrics is available 48-96 hours after online publication and is updated daily on week days.
Initial download of the metrics may take a while.