Fig. 18
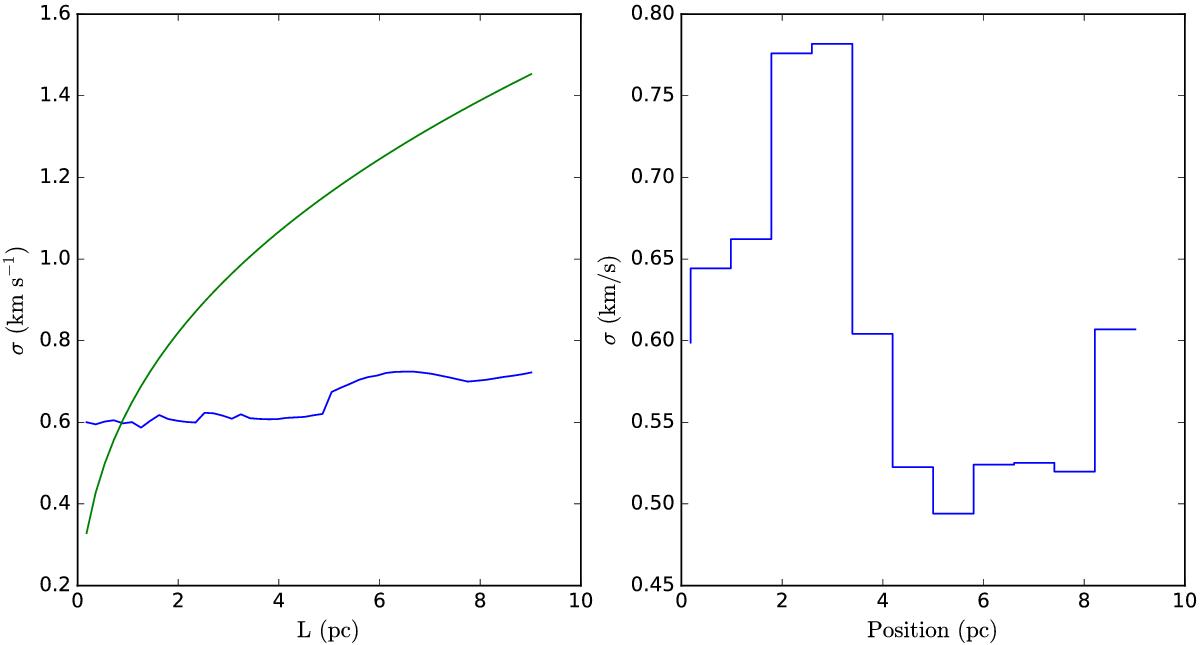
Left panel: correlation of the velocity dispersion as a function of the scale, the blue line, derived using the Osaka 13CO data. The green curve is the Larson’s relation σ = 0.63 L0.38, where L is the scale length; and right panel: velocity dispersion as a function of position in the filament, starting from north-west and moving south-east along the filament at one parsec scale.
Current usage metrics show cumulative count of Article Views (full-text article views including HTML views, PDF and ePub downloads, according to the available data) and Abstracts Views on Vision4Press platform.
Data correspond to usage on the plateform after 2015. The current usage metrics is available 48-96 hours after online publication and is updated daily on week days.
Initial download of the metrics may take a while.