Fig. 16
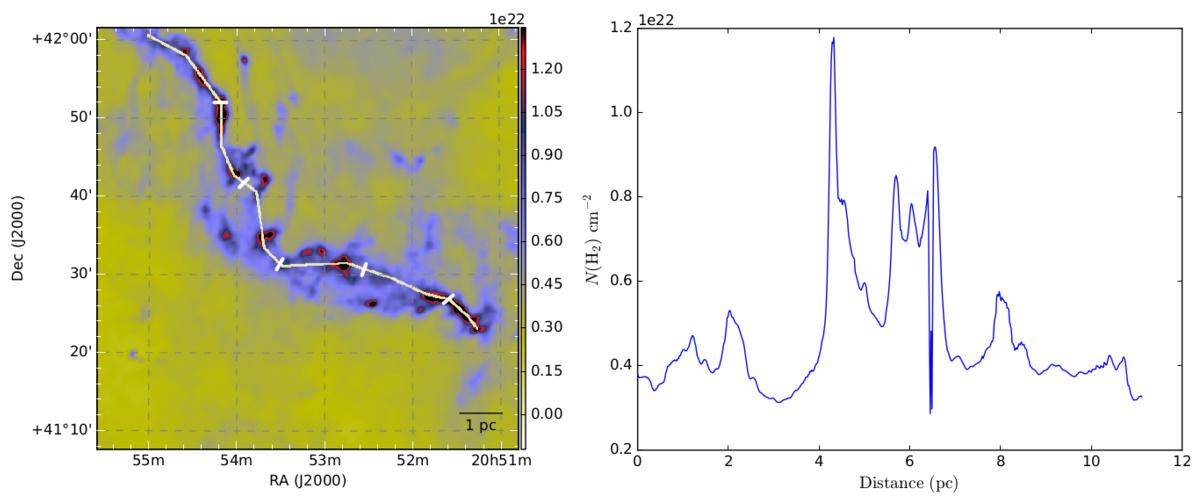
Right panel: average hydrogen column density following the white line in the left panel. The x-axis of the right panel shows the distance along the white line, starting from the upper-left corner and the white ticks on the line show steps of 2 pc. The column density values are computed as an average over 3 × 3 pixels. The colour map of the left panel corresponds to the hydrogen column density derived from the dust observations.
Current usage metrics show cumulative count of Article Views (full-text article views including HTML views, PDF and ePub downloads, according to the available data) and Abstracts Views on Vision4Press platform.
Data correspond to usage on the plateform after 2015. The current usage metrics is available 48-96 hours after online publication and is updated daily on week days.
Initial download of the metrics may take a while.