Free Access
Fig. 14
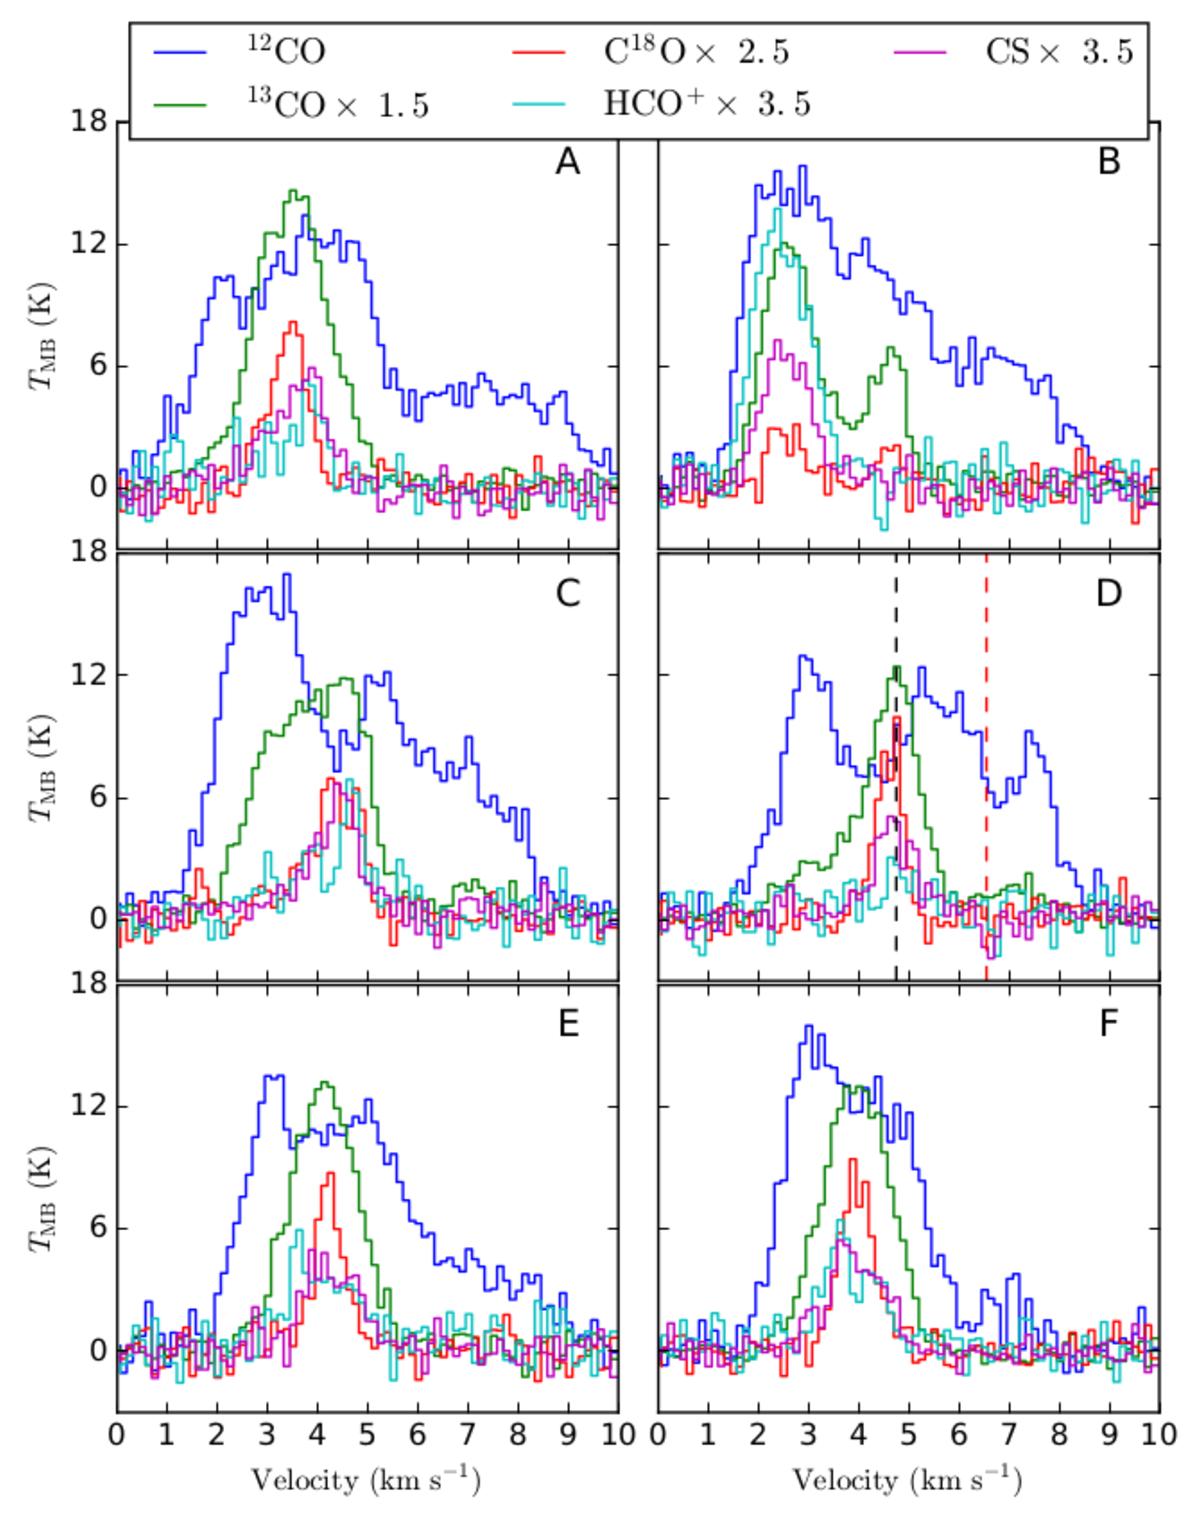
Spectra detected from clumps A–F in Fig. 6. The spectra are scaled by the factors shown at the top of the figure. The red and black broken lines in the panel for clump D indicate the velocity range used to calculate the mass accretion.
Current usage metrics show cumulative count of Article Views (full-text article views including HTML views, PDF and ePub downloads, according to the available data) and Abstracts Views on Vision4Press platform.
Data correspond to usage on the plateform after 2015. The current usage metrics is available 48-96 hours after online publication and is updated daily on week days.
Initial download of the metrics may take a while.