Free Access
Fig. 12
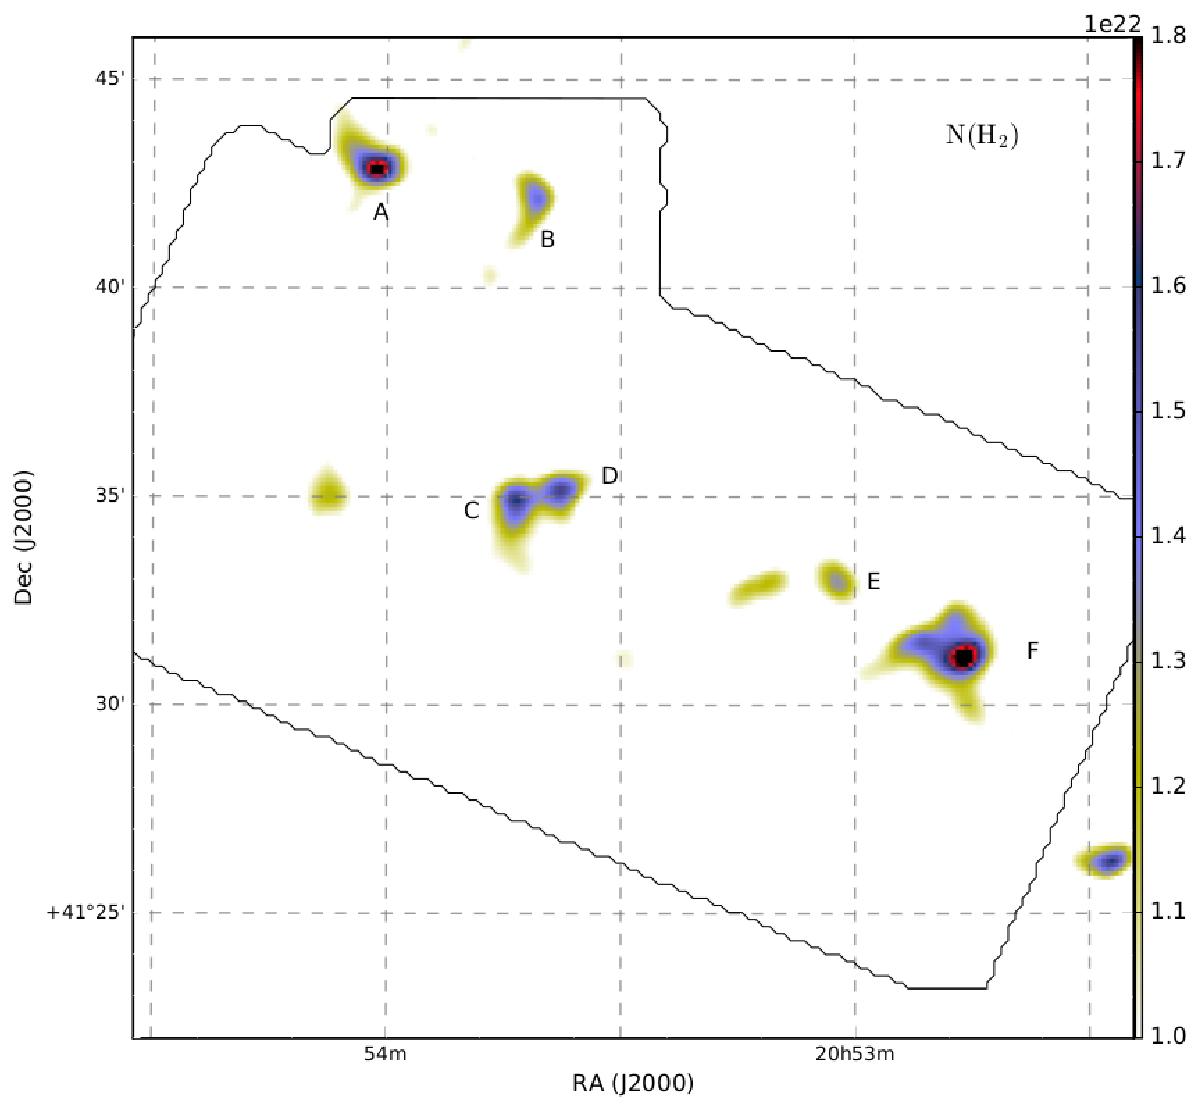
Masked H2 column-density map, showing the locations and column density of the clumps (labelled A to F) for which we have computed a mass estimate. The black contour shows the area of the Nobeyama observations.
Current usage metrics show cumulative count of Article Views (full-text article views including HTML views, PDF and ePub downloads, according to the available data) and Abstracts Views on Vision4Press platform.
Data correspond to usage on the plateform after 2015. The current usage metrics is available 48-96 hours after online publication and is updated daily on week days.
Initial download of the metrics may take a while.