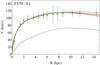
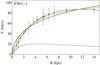
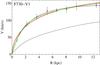
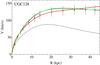
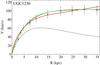
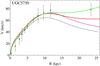
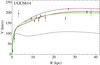
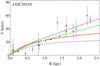
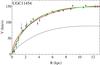
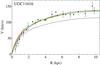
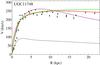
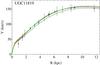
Fig. A.2
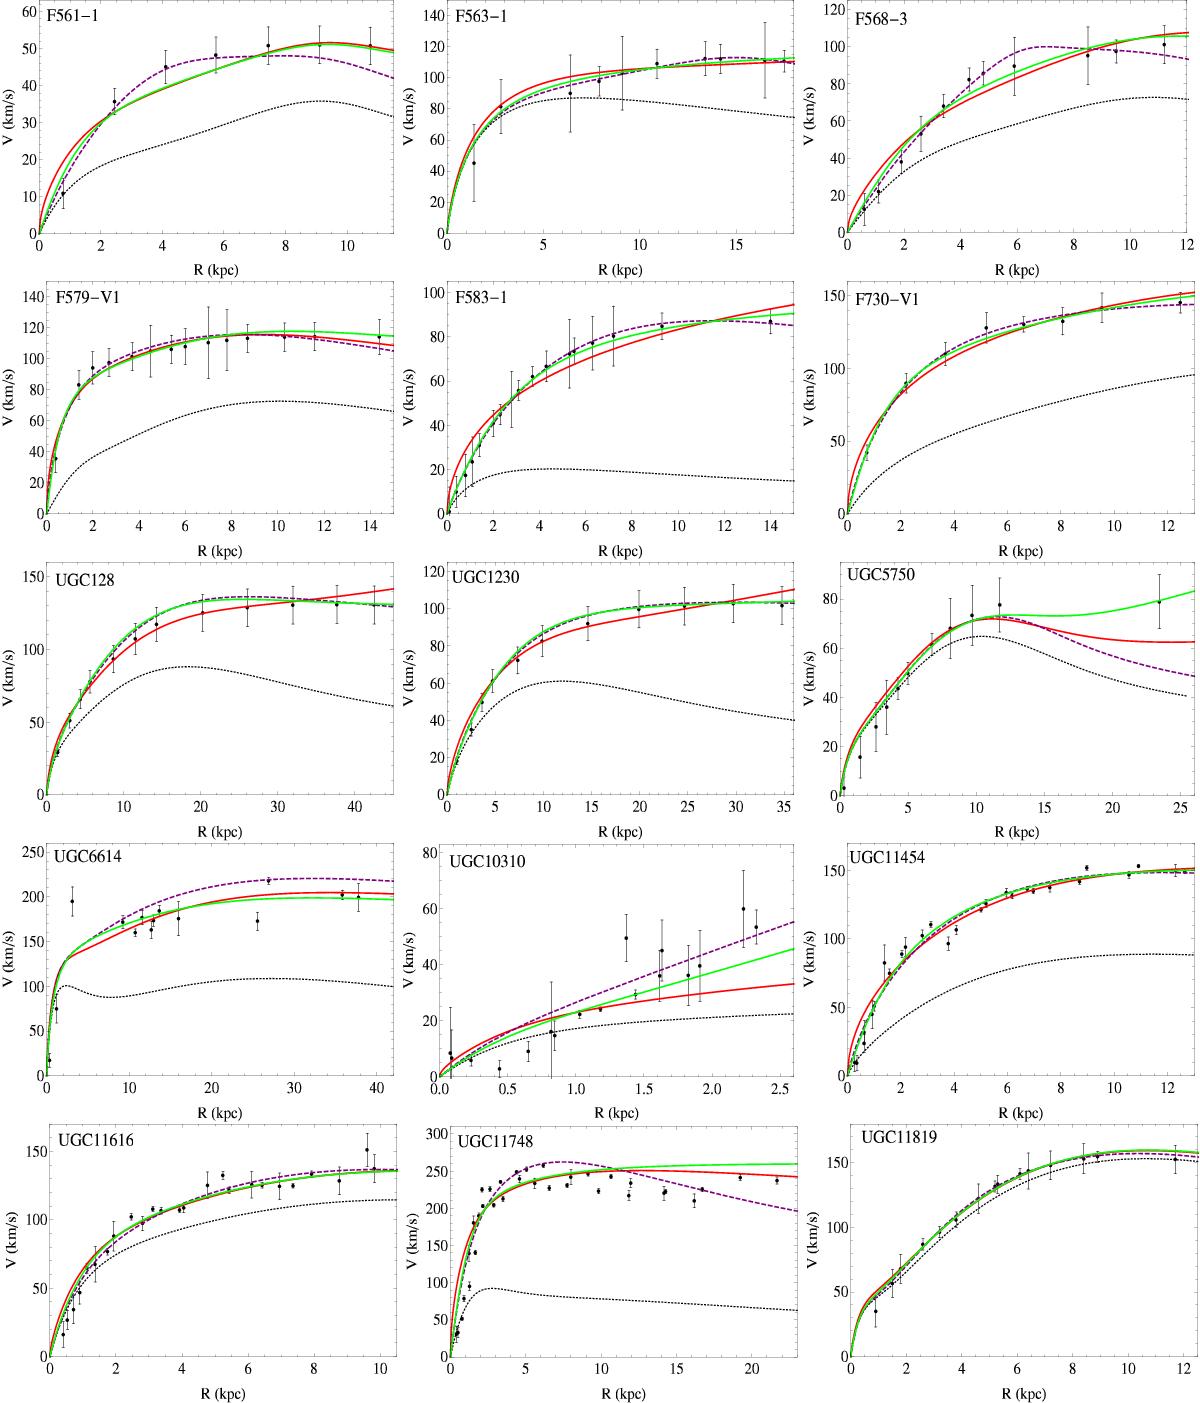
Best-fit rotational curves for the LSB galaxy sample. The dots with error bars denote archive rotational velocity curves derived from spectroscopic data. The fitted models are pure baryonic (black short-dashed curve), baryonic + NFW (red continuous curve), baryonic + Einasto (purple dashed curve), and baryonic + PSE (green continuous curve).
Current usage metrics show cumulative count of Article Views (full-text article views including HTML views, PDF and ePub downloads, according to the available data) and Abstracts Views on Vision4Press platform.
Data correspond to usage on the plateform after 2015. The current usage metrics is available 48-96 hours after online publication and is updated daily on week days.
Initial download of the metrics may take a while.