Free Access
Fig. 9
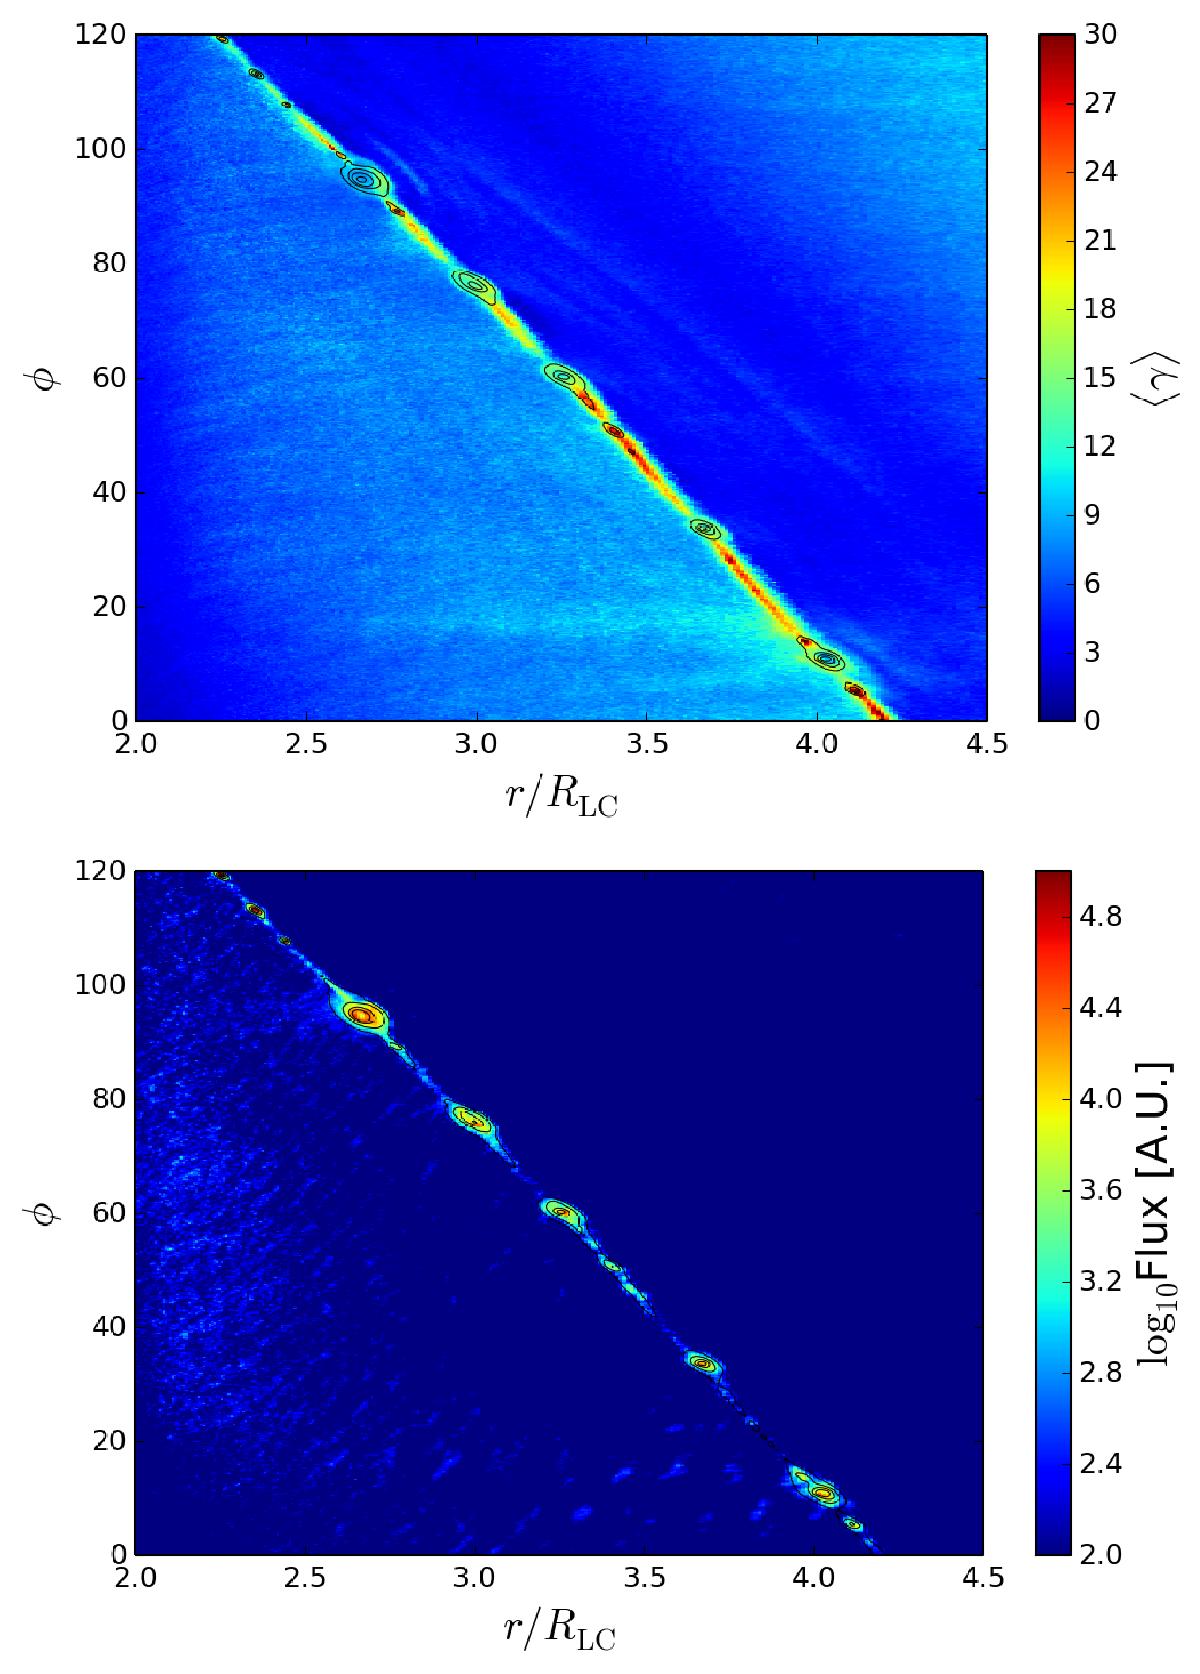
Spatial distribution of the particle mean Lorentz factor (top) and synchrotron flux (bottom, in arbitrary units) zoomed in on the innermost regions of the striped wind in run R3_S250_K10. The plasma density isocontours (black lines) show the location of plasmoids.
This figure is made of several images, please see below:
Current usage metrics show cumulative count of Article Views (full-text article views including HTML views, PDF and ePub downloads, according to the available data) and Abstracts Views on Vision4Press platform.
Data correspond to usage on the plateform after 2015. The current usage metrics is available 48-96 hours after online publication and is updated daily on week days.
Initial download of the metrics may take a while.