Free Access
Fig. 6
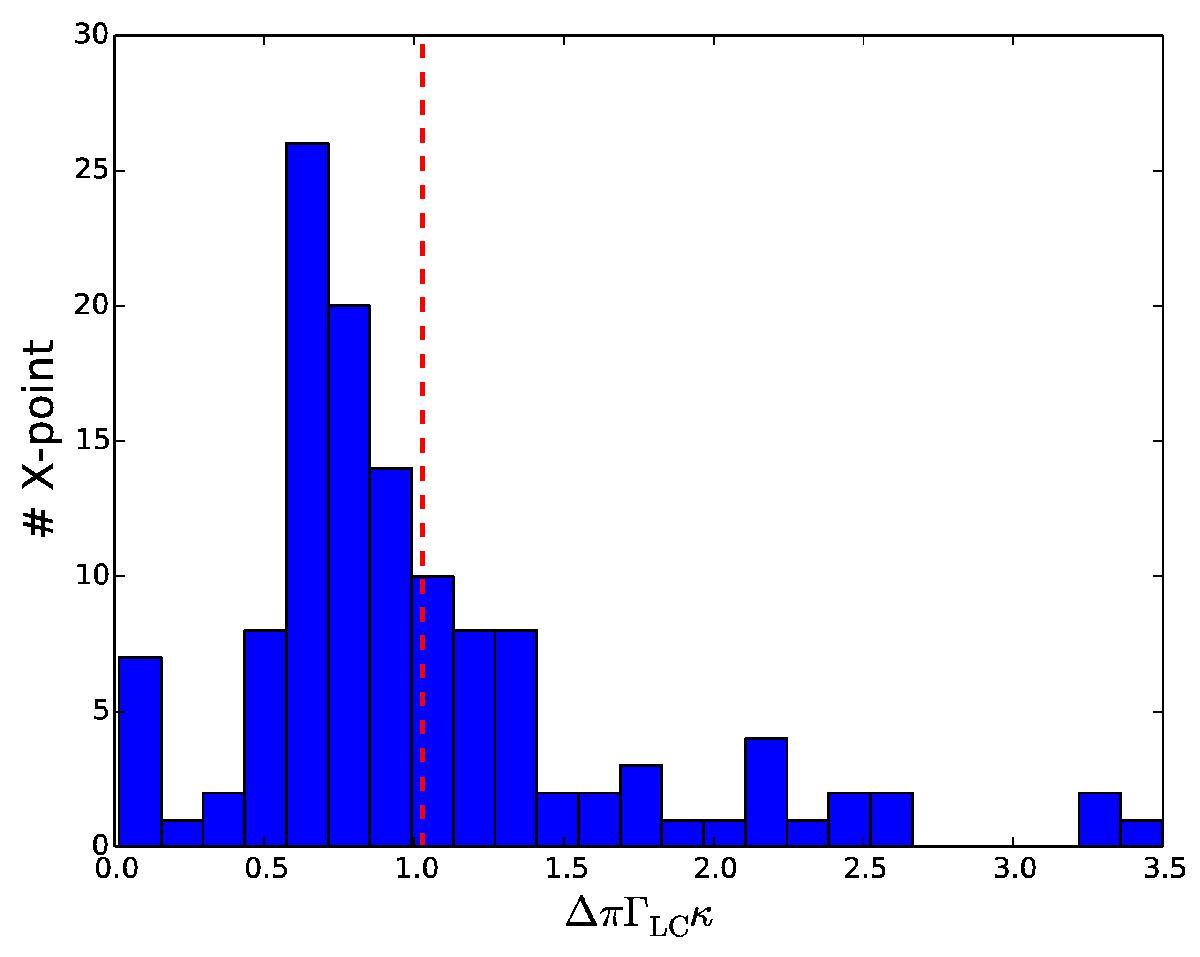
Distribution of the product ΔπΓLCκ computed at each X-point along the striped wind (run R3_S250_K10). The distribution peaks at ΔπΓLCκ ≈ 0.7 with a mean value of order unity (vertical red dashed line) as expected from Eq. (10).
Current usage metrics show cumulative count of Article Views (full-text article views including HTML views, PDF and ePub downloads, according to the available data) and Abstracts Views on Vision4Press platform.
Data correspond to usage on the plateform after 2015. The current usage metrics is available 48-96 hours after online publication and is updated daily on week days.
Initial download of the metrics may take a while.