Free Access
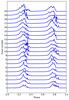
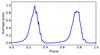
Fig. 14
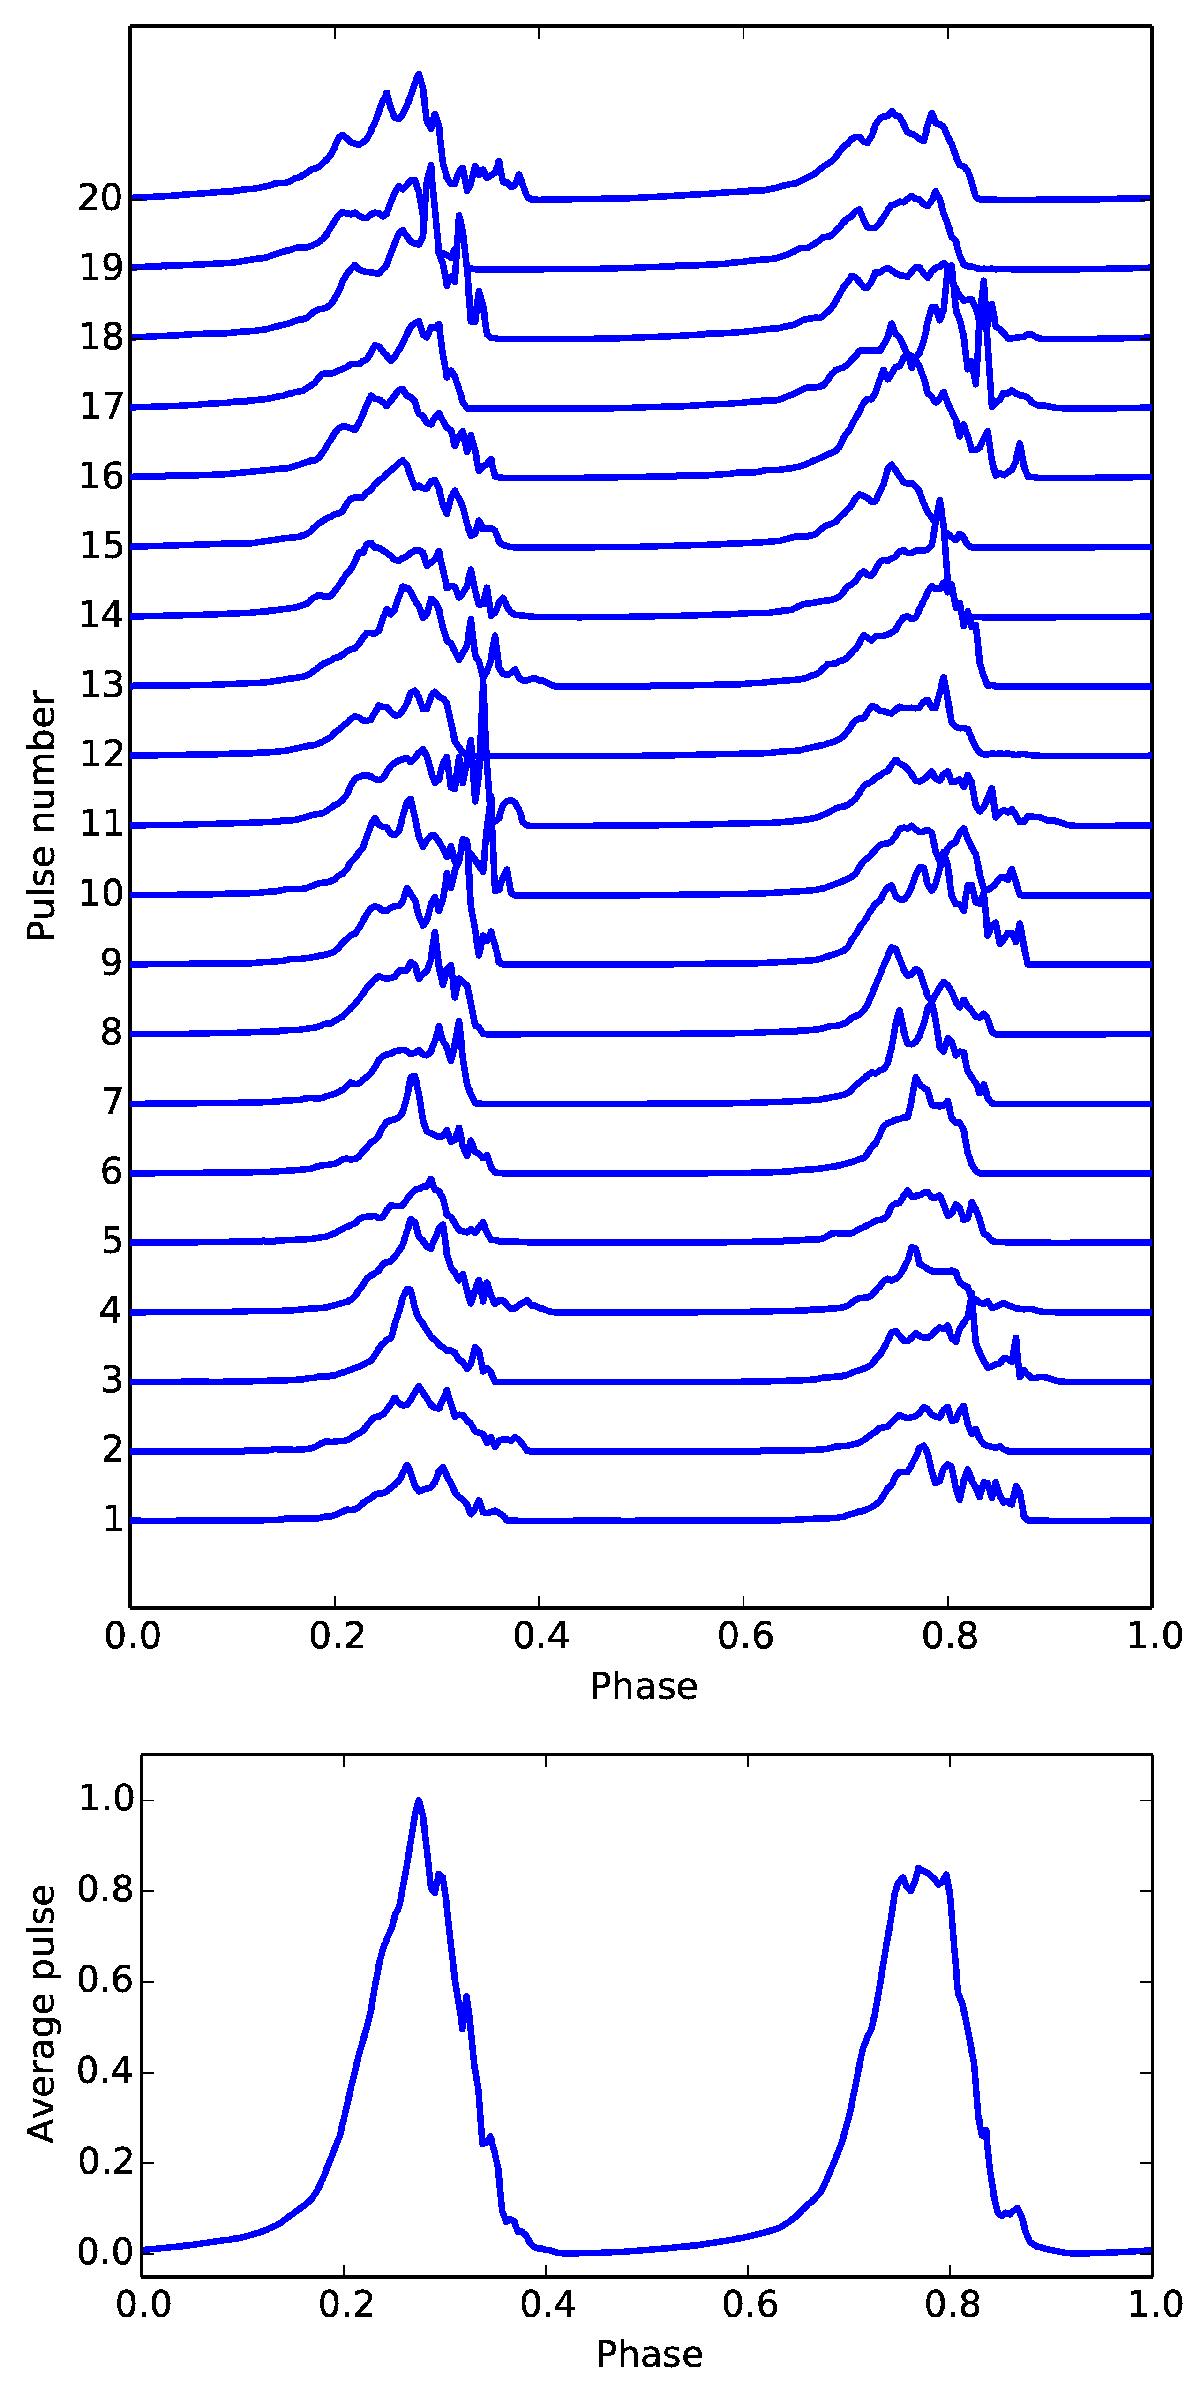
Top: series of individual pulse profiles computed after each pulsar period. Bottom: pulse profile averaged over all periods. The origin of phases is defined by the direction of the north magnetic pole.
This figure is made of several images, please see below:
Current usage metrics show cumulative count of Article Views (full-text article views including HTML views, PDF and ePub downloads, according to the available data) and Abstracts Views on Vision4Press platform.
Data correspond to usage on the plateform after 2015. The current usage metrics is available 48-96 hours after online publication and is updated daily on week days.
Initial download of the metrics may take a while.