Fig. 6
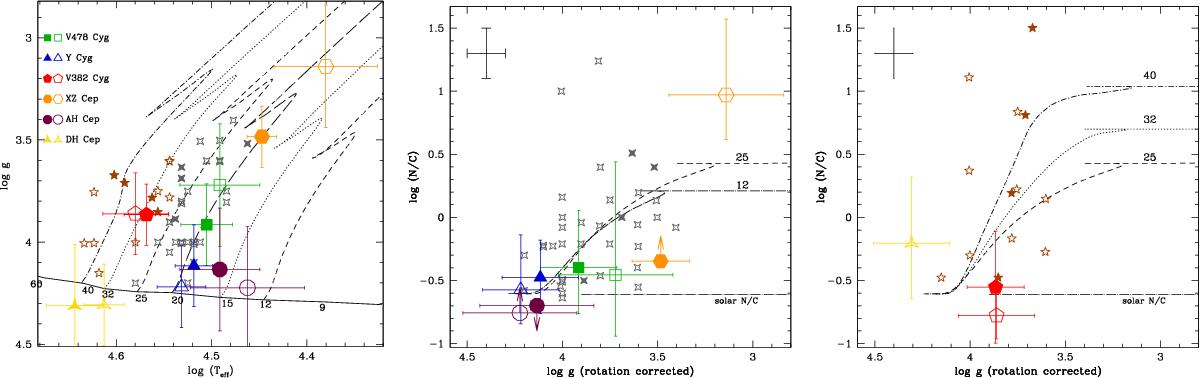
Left: log g – Teff (left) diagram for the sample stars together with comparison single stars from Martins et al. (2015). In the comparison sample, gray asterisks (brown stars) refer to stars less (more) massive than ~28 M⊙. Filled symbols (stars and asterisks) refer to comparison stars with V sin i> 120 km s-1. For clarity only a representative error bar for the comparison sample is shown. The evolutionary models including rotation of Ekström et al. (2012) are shown. Middle and right: log (N/C) – log g diagram for stars with masses lower than 28 M⊙ (middle) and higher than 28 M⊙ (right). In all panels big symbols have the same meaning as in Fig. 4.
Current usage metrics show cumulative count of Article Views (full-text article views including HTML views, PDF and ePub downloads, according to the available data) and Abstracts Views on Vision4Press platform.
Data correspond to usage on the plateform after 2015. The current usage metrics is available 48-96 hours after online publication and is updated daily on week days.
Initial download of the metrics may take a while.