Fig. 6
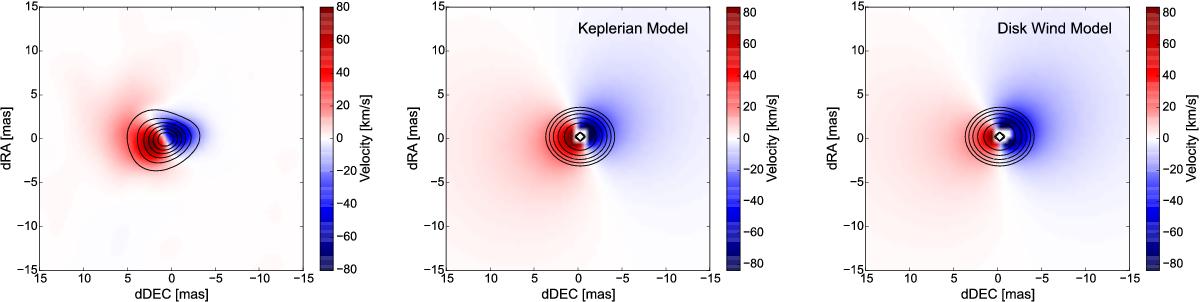
Left panel: first moment map for the Brγ line computed from our MWC297 AMBER images (shown in Fig. 5, upper panel). Black contours show the continuum emission region. Middle panel: first moment map constructed from the frames of our Keplerian disk model. Right panel: first moment map constructed from the frames of our disk wind model.
Current usage metrics show cumulative count of Article Views (full-text article views including HTML views, PDF and ePub downloads, according to the available data) and Abstracts Views on Vision4Press platform.
Data correspond to usage on the plateform after 2015. The current usage metrics is available 48-96 hours after online publication and is updated daily on week days.
Initial download of the metrics may take a while.