Fig. 3
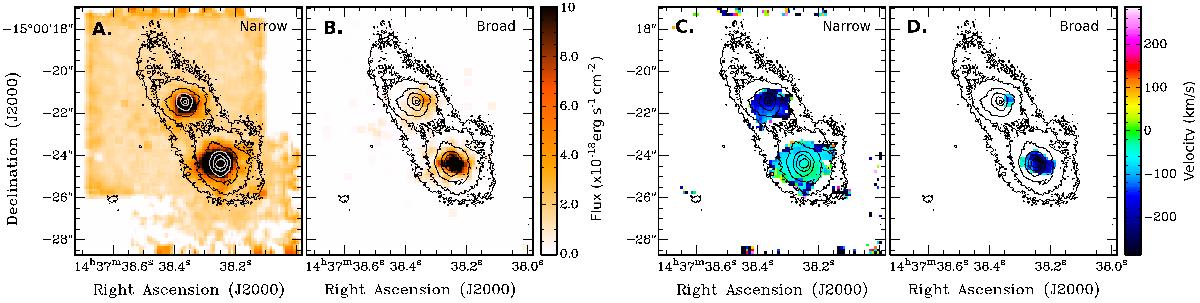
Decomposition of the H2 1–0 S(1) emission in IRAS 14348-1447. Left: flux of the narrow (A) and broad (B) component of the H2 emission. Right: velocity map of the narrow (C) and broad (D) component of the H2 emission in the region where the corresponding flux is ≥3 × 10-18 erg s-1 cm-2 spaxel-1 for both the narrow and the broad component. The dark contours visualize an image taken with HST/NICMOS in the combined F220M+F160W+F110W filters (Scoville et al. 2000). HST contours start at ~5σ, and are drawn at 1, 2, 5, 9, 18, 36% of the peak intensity of the SW galaxy, which is the galaxy that shows the broad-component emission.
Current usage metrics show cumulative count of Article Views (full-text article views including HTML views, PDF and ePub downloads, according to the available data) and Abstracts Views on Vision4Press platform.
Data correspond to usage on the plateform after 2015. The current usage metrics is available 48-96 hours after online publication and is updated daily on week days.
Initial download of the metrics may take a while.