Free Access
Fig. B.1
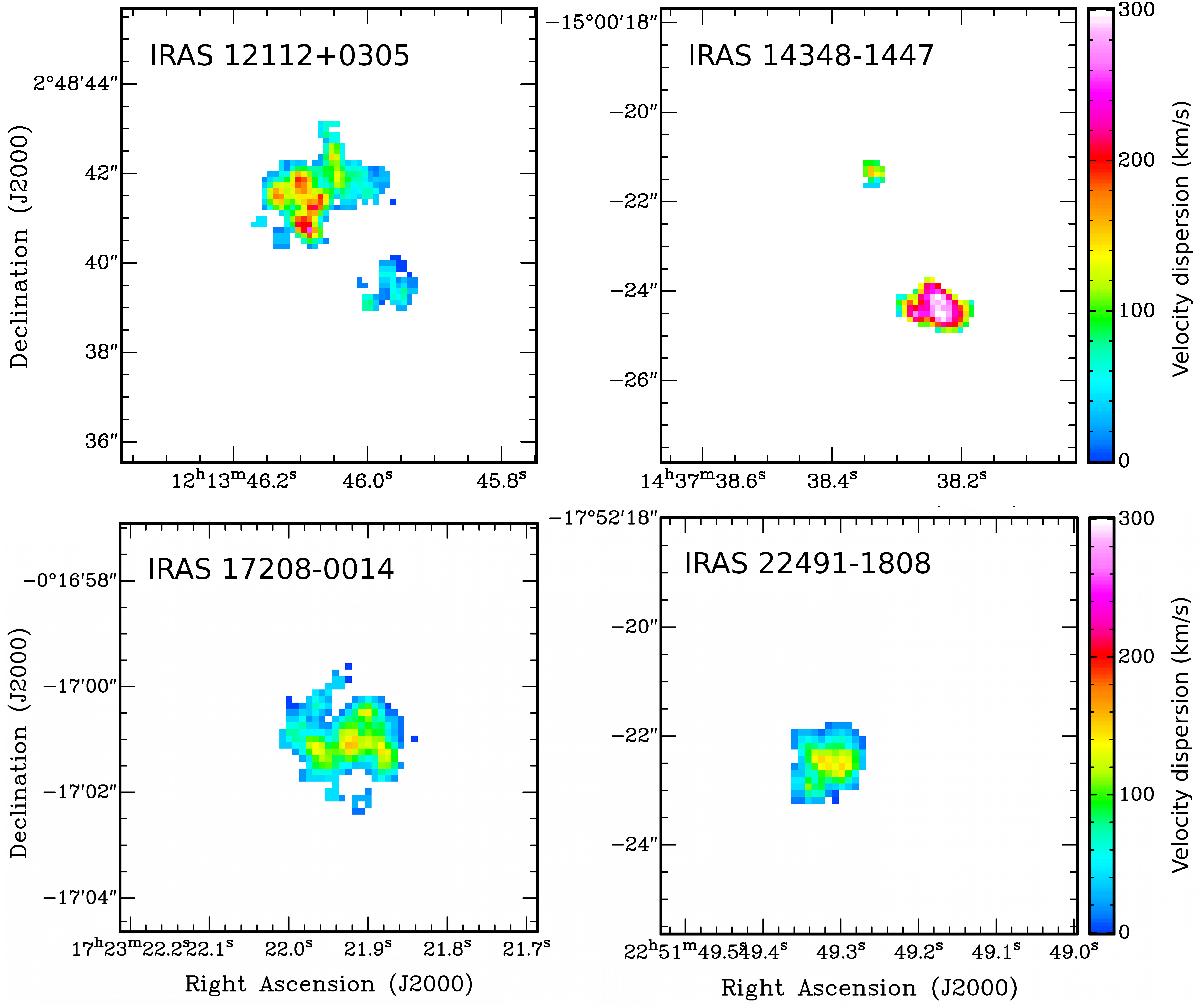
Maps of the velocity dispersion, σ = FWHM/2.35, of the broad-component H2 1–0 S(1) emission in IRAS 12112+0305, IRAS 14348-1447, IRAS 17208-0014, and IRAS 22491-1808. The velocity scaling is the same in all four plots.
Current usage metrics show cumulative count of Article Views (full-text article views including HTML views, PDF and ePub downloads, according to the available data) and Abstracts Views on Vision4Press platform.
Data correspond to usage on the plateform after 2015. The current usage metrics is available 48-96 hours after online publication and is updated daily on week days.
Initial download of the metrics may take a while.