Fig. 3
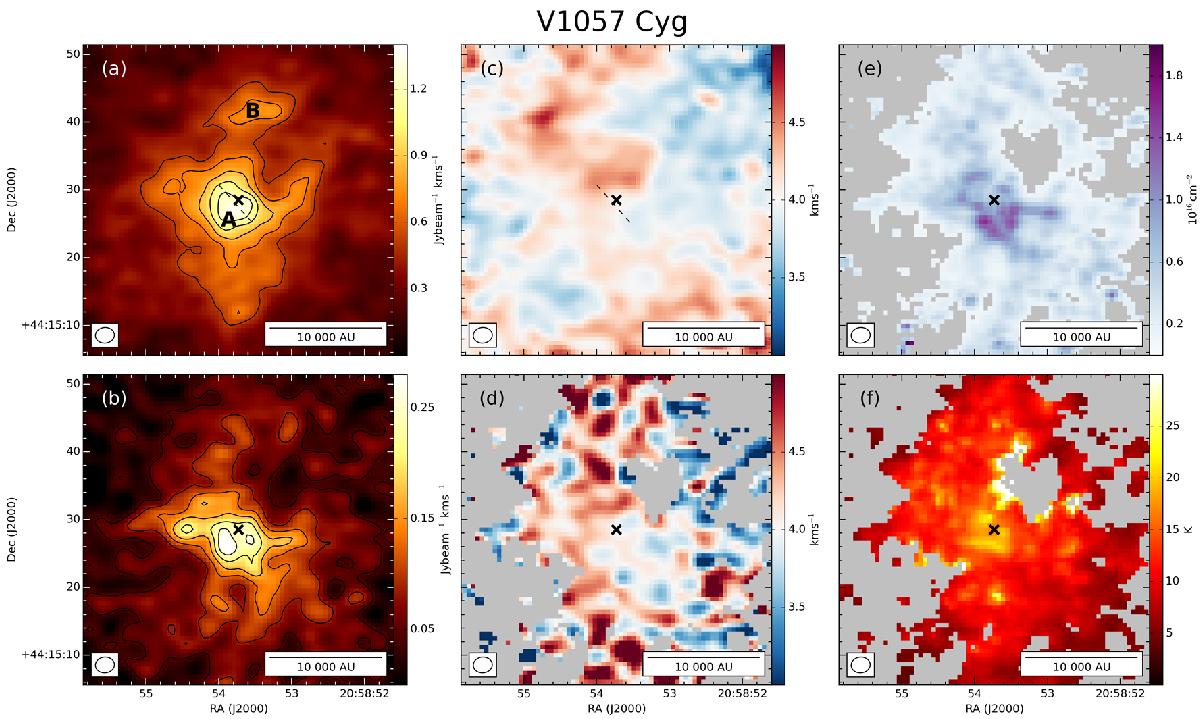
Moment and physical parameter maps of V1057 Cyg: a) 13CO integrated intensity; b) C18O integrated intensity; c) 13CO intensity weighted velocity; d) C18O intensity weighted velocity; e) C18O column density; f) temperature. The black cross marks the position of the FUor and letters indicate the clumps that are discussed in the text. The solid contours mark the nσint levels (the multiples of the noise level on the map); σint = 0.17 Jy beam-1 km s-1 and n = 3, 4, ..., 8 on (a) and σint = 0.014 Jy beam-1 km s-1 and n = 3, 6, ..., 18 on (b). The pixels with C18O peak values less than 9σ are coloured grey on panels d, e and f.
Current usage metrics show cumulative count of Article Views (full-text article views including HTML views, PDF and ePub downloads, according to the available data) and Abstracts Views on Vision4Press platform.
Data correspond to usage on the plateform after 2015. The current usage metrics is available 48-96 hours after online publication and is updated daily on week days.
Initial download of the metrics may take a while.