Fig. 11
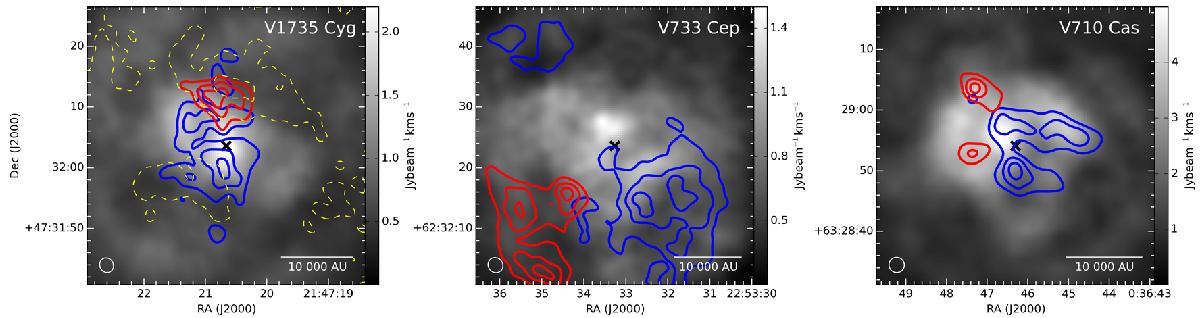
Outflow features around V1735 Cyg, V733 Cep and V710 Cas. The grey-scale shows the integrated intensity of the line similarly as on the moment map, black crosses mark the position of the FUors and blue and red lines the integrated intensity contours on the line wings at 50, 70 and 90% of the peak value. The line wings were integrated between the following velocities: the blue wing between −0.2 and 2 km s-1 and the red wing between 7 and 9.4 km s-1 towards V1735 Cyg; the blue wing between −12.9 and −10.7 km s-1 and the red wing between −7.4 and −6.0 km s-1 towards V733 Cep; the blue wing between −23.3 and −19.6 km s-1 and the red wing between −15.6 and −13.3 km s-1 towards V710 Cas. The yellow dashed contours mark the 13CO FWHM linewidth contours at 4 and 5 km s-1.
Current usage metrics show cumulative count of Article Views (full-text article views including HTML views, PDF and ePub downloads, according to the available data) and Abstracts Views on Vision4Press platform.
Data correspond to usage on the plateform after 2015. The current usage metrics is available 48-96 hours after online publication and is updated daily on week days.
Initial download of the metrics may take a while.