Fig. 1
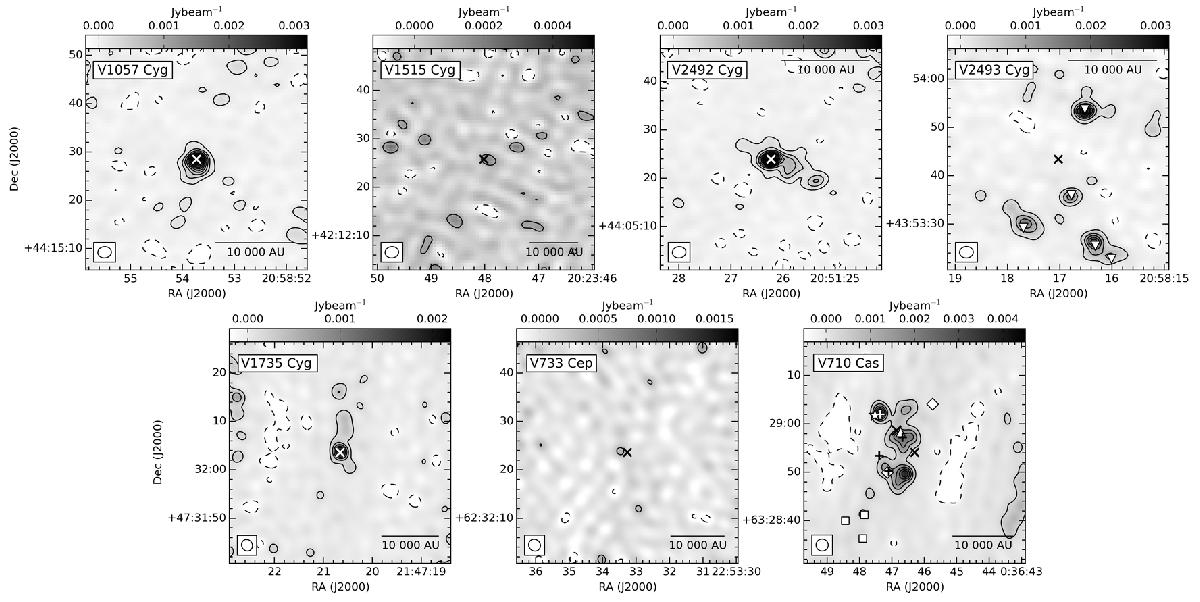
2.7 mm continuum maps of the sources. No short-spacing data was combined with the interferometric observations of the continuum. The solid lines mark the 3σ, 9σ, 15σ... contour levels and dashed lines show the –3σ contour level. Crosses mark the positions of the FUors and the beam is shown in the bottom-left corner. Other associated sources are marked as follows: upside down triangles mark the millimetre sources around V2493 Cyg from Dunham et al. (2012), in the region around V710 Cas (RNO 1B) a second cross marks RNO 1C, an asterisk marks IRAS 00338+6312 (Staude & Neckel 1991), crosses mark the radio sources from Anglada et al. (1994), triangle marks the sub-millimetre source from Sandell & Weintraub (2001), squares mark the IRAC sources from Quanz et al. (2007a) and diamonds mark RNO 1F and RNO 1G.
Current usage metrics show cumulative count of Article Views (full-text article views including HTML views, PDF and ePub downloads, according to the available data) and Abstracts Views on Vision4Press platform.
Data correspond to usage on the plateform after 2015. The current usage metrics is available 48-96 hours after online publication and is updated daily on week days.
Initial download of the metrics may take a while.