Free Access
Fig. 6
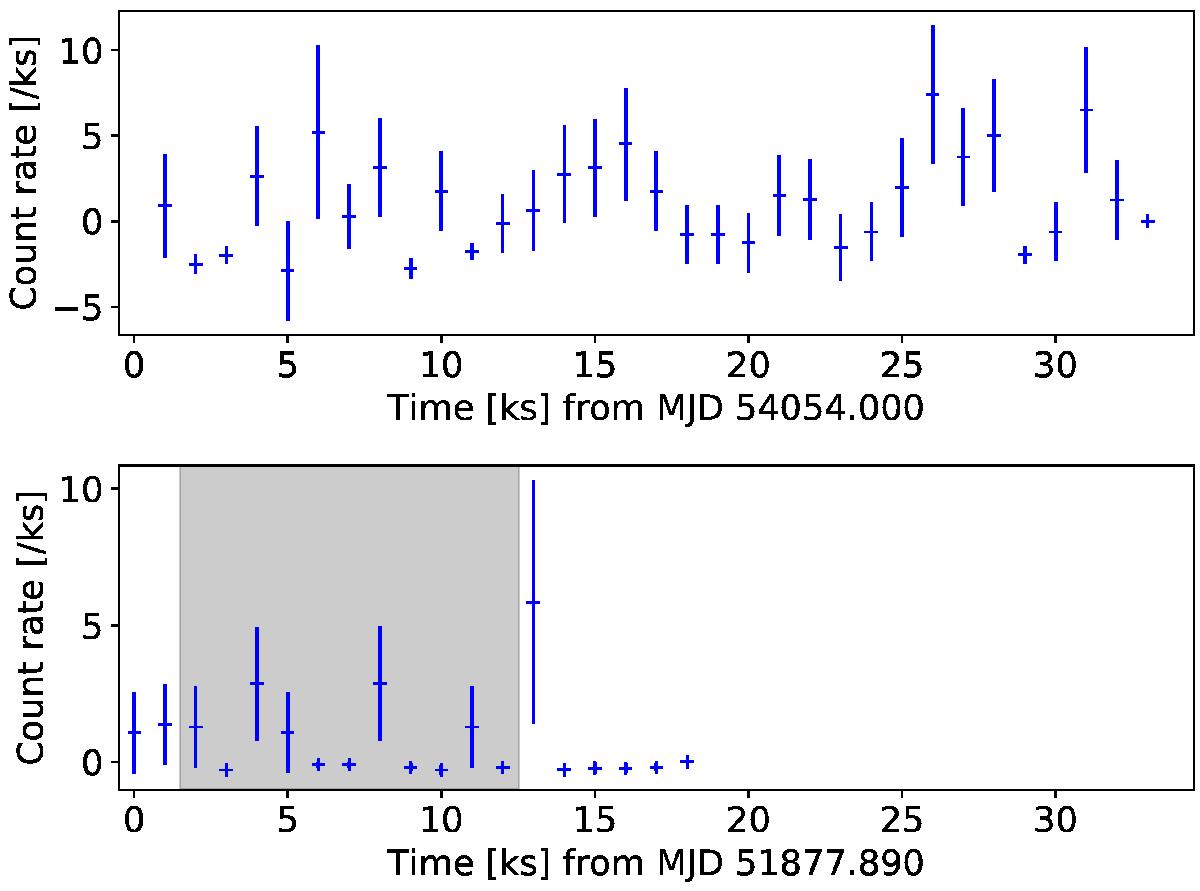
Background-subtracted 0.15−1.5 keV XMM-Newton light curves with a binning of 1 ks. The top panel shows the 2006 pn light curve and the bottom panel shows the 2000 MOS2 light curve. The shaded area in the bottom panel indicates the transit duration.
Current usage metrics show cumulative count of Article Views (full-text article views including HTML views, PDF and ePub downloads, according to the available data) and Abstracts Views on Vision4Press platform.
Data correspond to usage on the plateform after 2015. The current usage metrics is available 48-96 hours after online publication and is updated daily on week days.
Initial download of the metrics may take a while.