Fig. 8
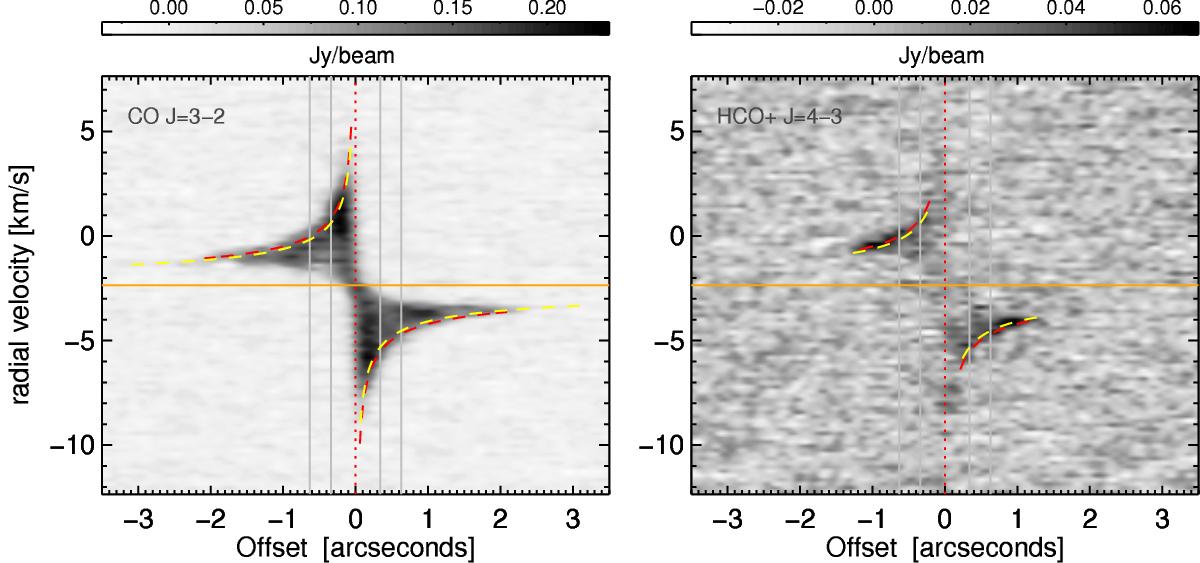
Position-velocity diagram for the CO J = 3−2 (left) and HCO+J = 3−2 (right) emission made using the disk center and position angle listed in Table 2. We use a dotted vertical red line to show the stellar position. The systemic velocity of –2.35 km s-1 is shown with an orange horizontal line. We show the Keplerian rotation curves for the two different estimates for stellar mass and distance from Merín et al. (2004; yellow: M∗ = 1.59 M⊙ and d = 348 pc) and from Piétu et al. (2003; red: M∗ = 2.1 M⊙ and d = 400 pc). The radial inner and outer extent of the curves is taken from the inner and outer radius of the emission listed in Table 3. We also overplot in both panels with gray vertical lines the radial distances of 0.34′′ and 0.63′′ to mark the band where the continuum emission is strongest.
Current usage metrics show cumulative count of Article Views (full-text article views including HTML views, PDF and ePub downloads, according to the available data) and Abstracts Views on Vision4Press platform.
Data correspond to usage on the plateform after 2015. The current usage metrics is available 48-96 hours after online publication and is updated daily on week days.
Initial download of the metrics may take a while.