Free Access
Fig. 1
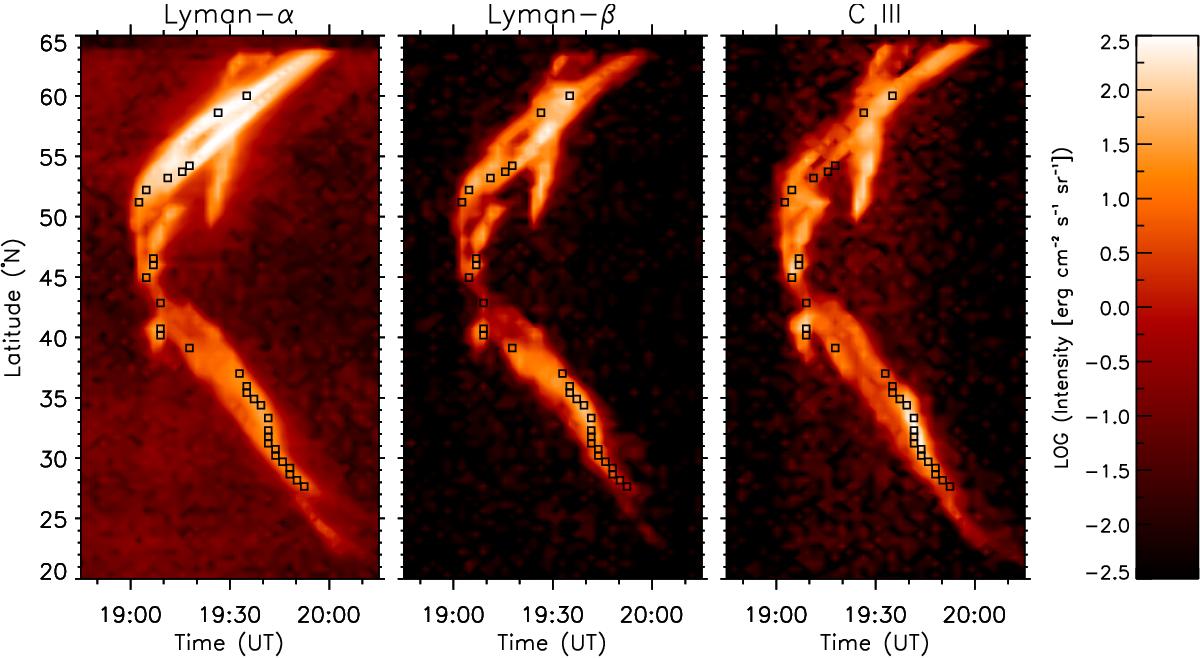
Intensity distribution of the narrow components of the Lα and Lβ lines, and of the C iii line, plotted as a function of time and latitude along the UVCS slit. The locations of the 30 optically thin points we chose for the analysis are marked with squares.
Current usage metrics show cumulative count of Article Views (full-text article views including HTML views, PDF and ePub downloads, according to the available data) and Abstracts Views on Vision4Press platform.
Data correspond to usage on the plateform after 2015. The current usage metrics is available 48-96 hours after online publication and is updated daily on week days.
Initial download of the metrics may take a while.