Free Access
Fig. 3
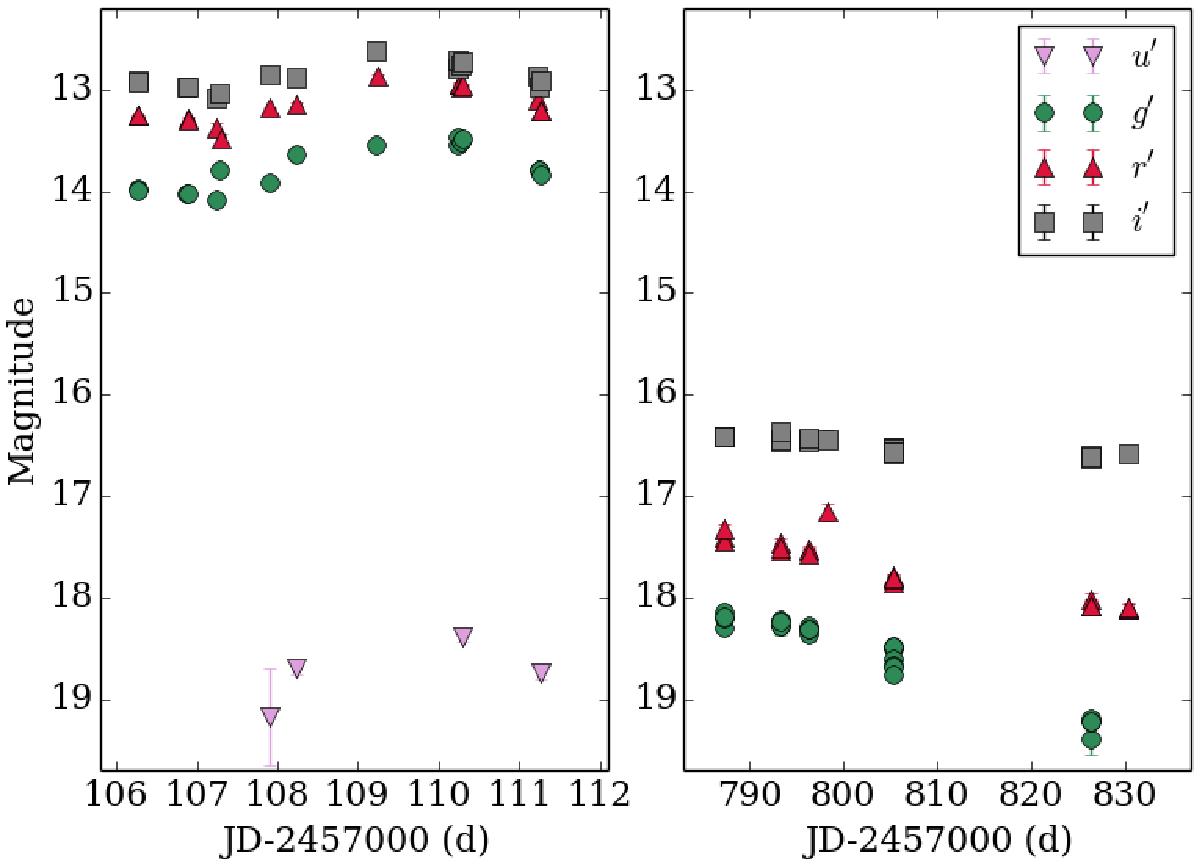
LCOGT light curve in u′, g′, r′, and i′ filters. Given the long time span between the two datasets, the outburst and post-outburst phases have been separated. The magnitudes are calibrated using SDSS data. We highlight the change in color of the object in the post-outburst phase.
Current usage metrics show cumulative count of Article Views (full-text article views including HTML views, PDF and ePub downloads, according to the available data) and Abstracts Views on Vision4Press platform.
Data correspond to usage on the plateform after 2015. The current usage metrics is available 48-96 hours after online publication and is updated daily on week days.
Initial download of the metrics may take a while.