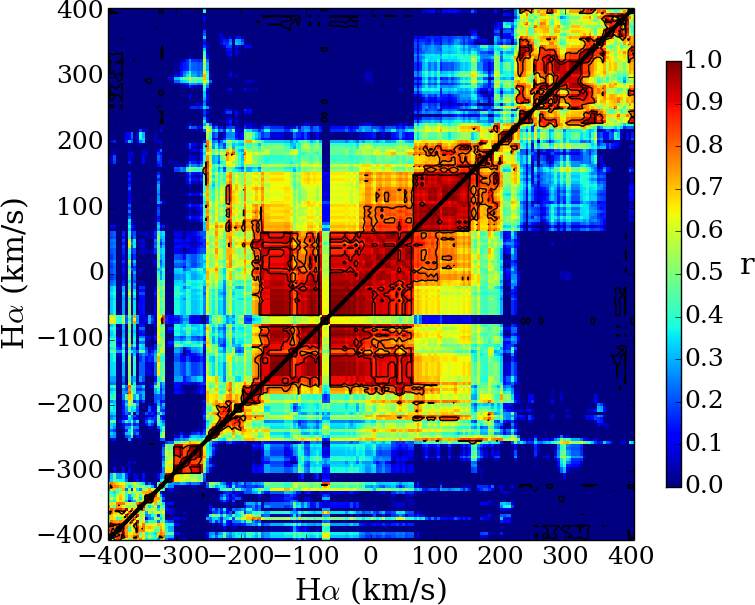
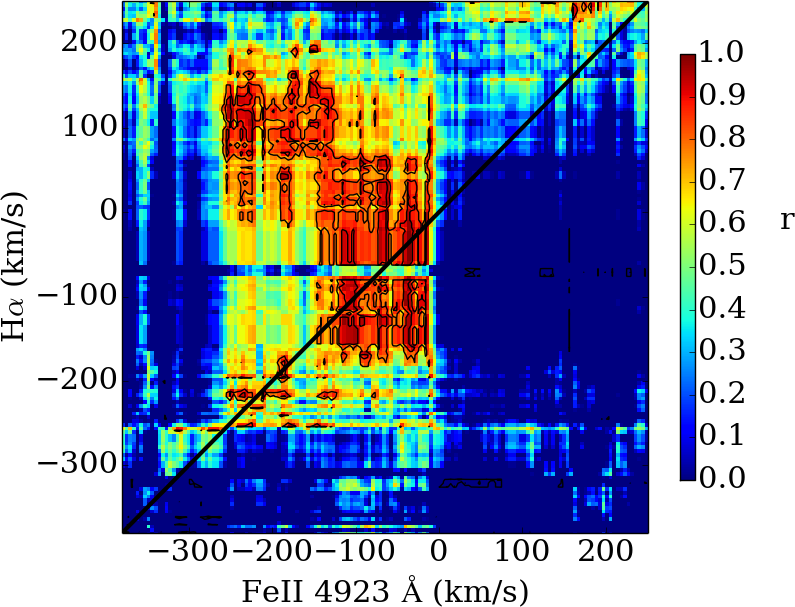
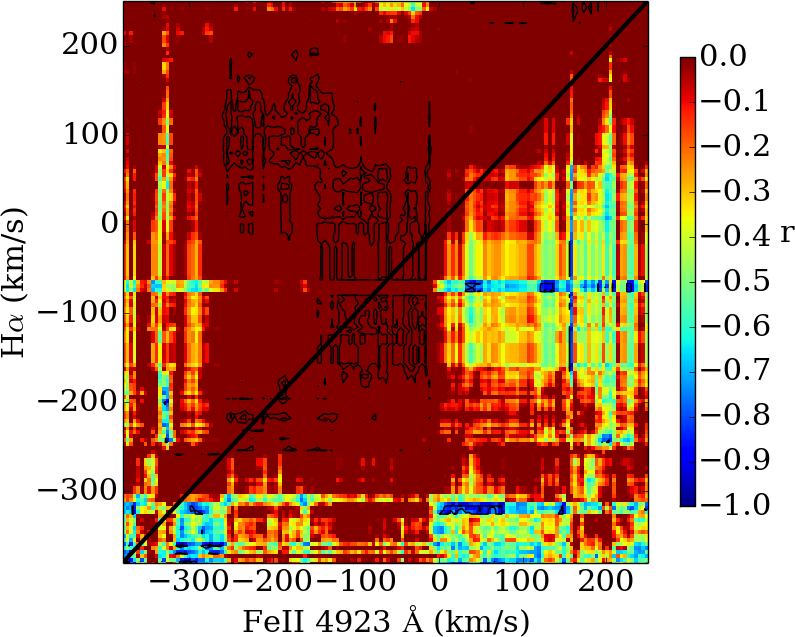
Fig. 14
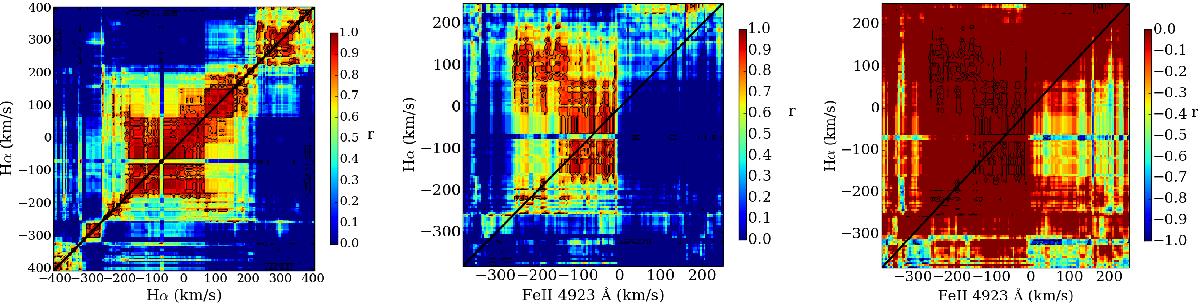
Auto-correlation (left) and cross-correlation of Hα with the Fe II 4923 Å line; including positive (middle) and negative (right) correlations. The color scheme shows the value of the Spearman rank correlation parameter r, and the black contours mark the high-significance areas with false-alarm probability 1e-3 and 1e-4, respectively.
Current usage metrics show cumulative count of Article Views (full-text article views including HTML views, PDF and ePub downloads, according to the available data) and Abstracts Views on Vision4Press platform.
Data correspond to usage on the plateform after 2015. The current usage metrics is available 48-96 hours after online publication and is updated daily on week days.
Initial download of the metrics may take a while.