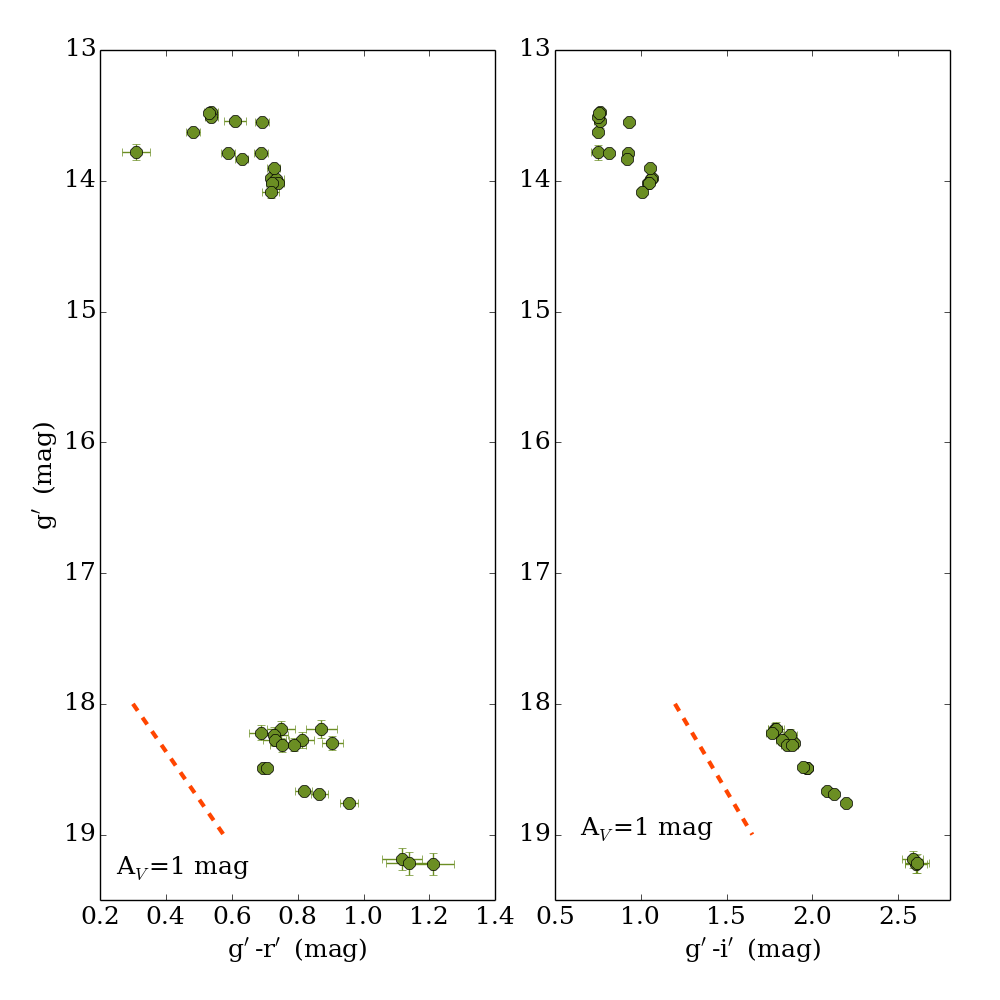
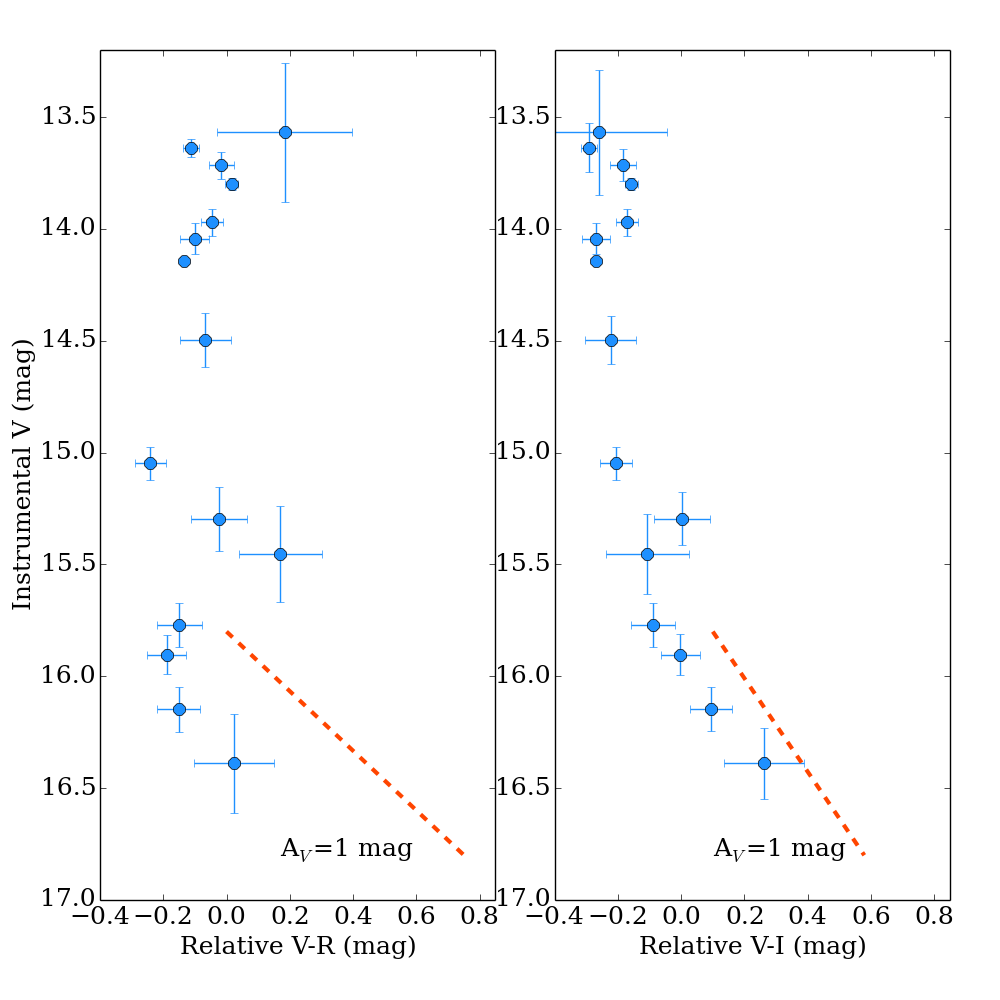
Fig. 12
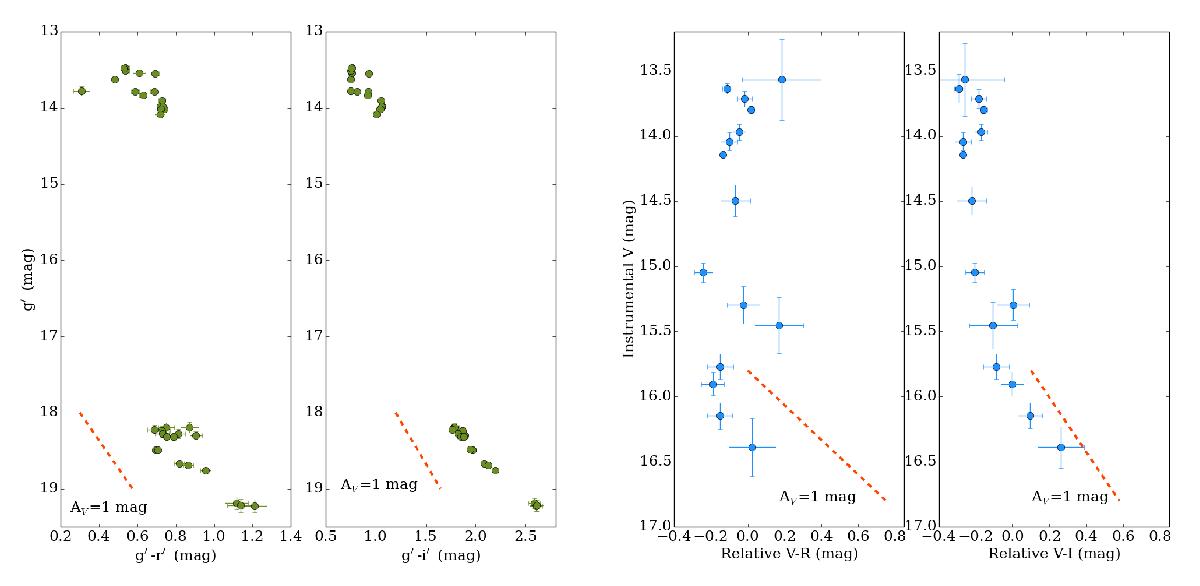
Color-magnitude diagrams showing the color evolution as observed by the LCOGT (left) and the Beacon Observatory (right). For the Kent data, since the different filters are not cross-calibrated, the colors are shifted around the median value and only the relative color variation is relevant. A reddening vector (Cardelli et al. 1989; Stoughton et al. 2002) is shown for comparison.
Current usage metrics show cumulative count of Article Views (full-text article views including HTML views, PDF and ePub downloads, according to the available data) and Abstracts Views on Vision4Press platform.
Data correspond to usage on the plateform after 2015. The current usage metrics is available 48-96 hours after online publication and is updated daily on week days.
Initial download of the metrics may take a while.