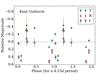
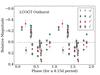
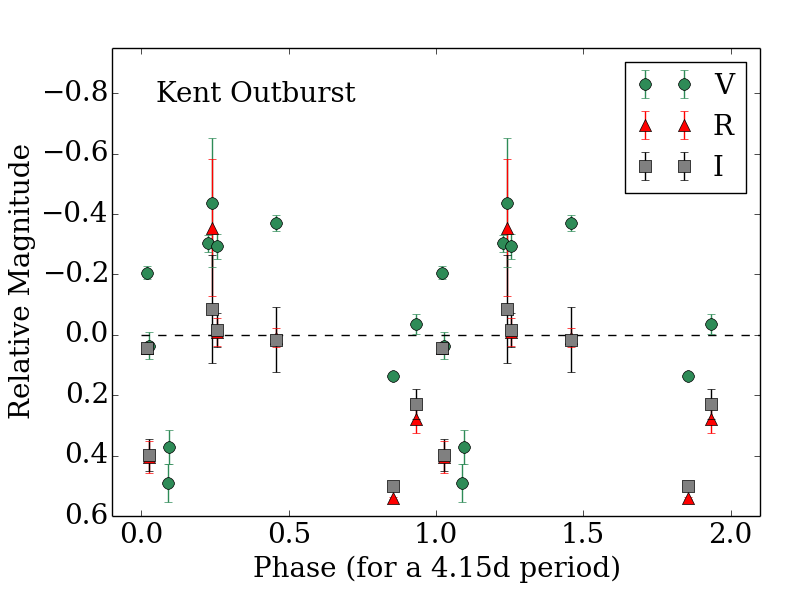
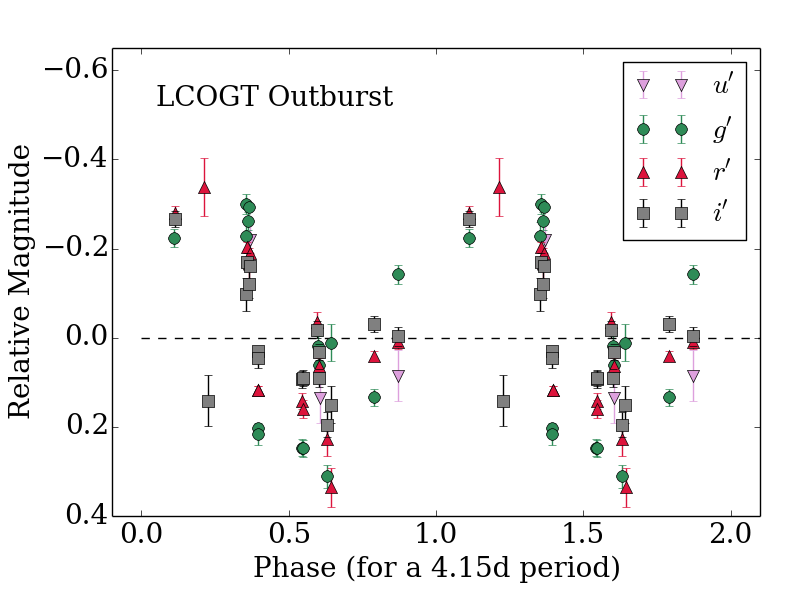
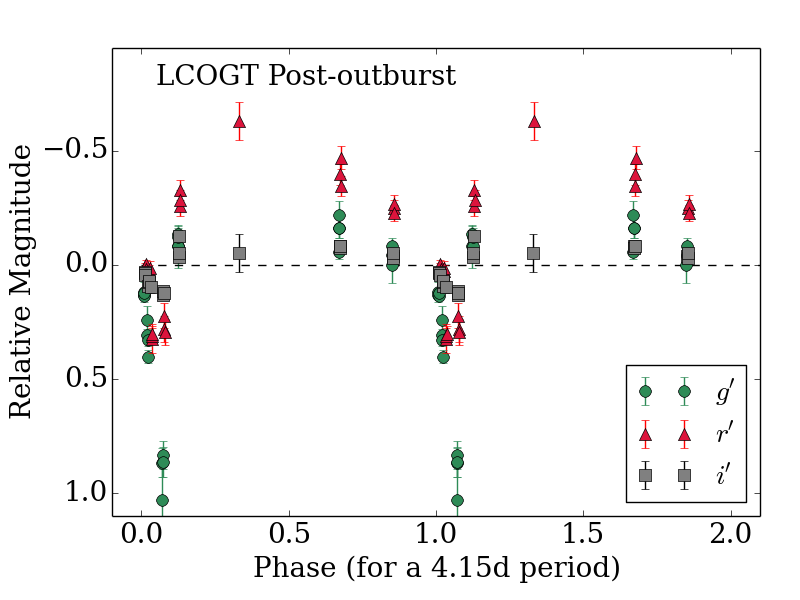
Fig. 11
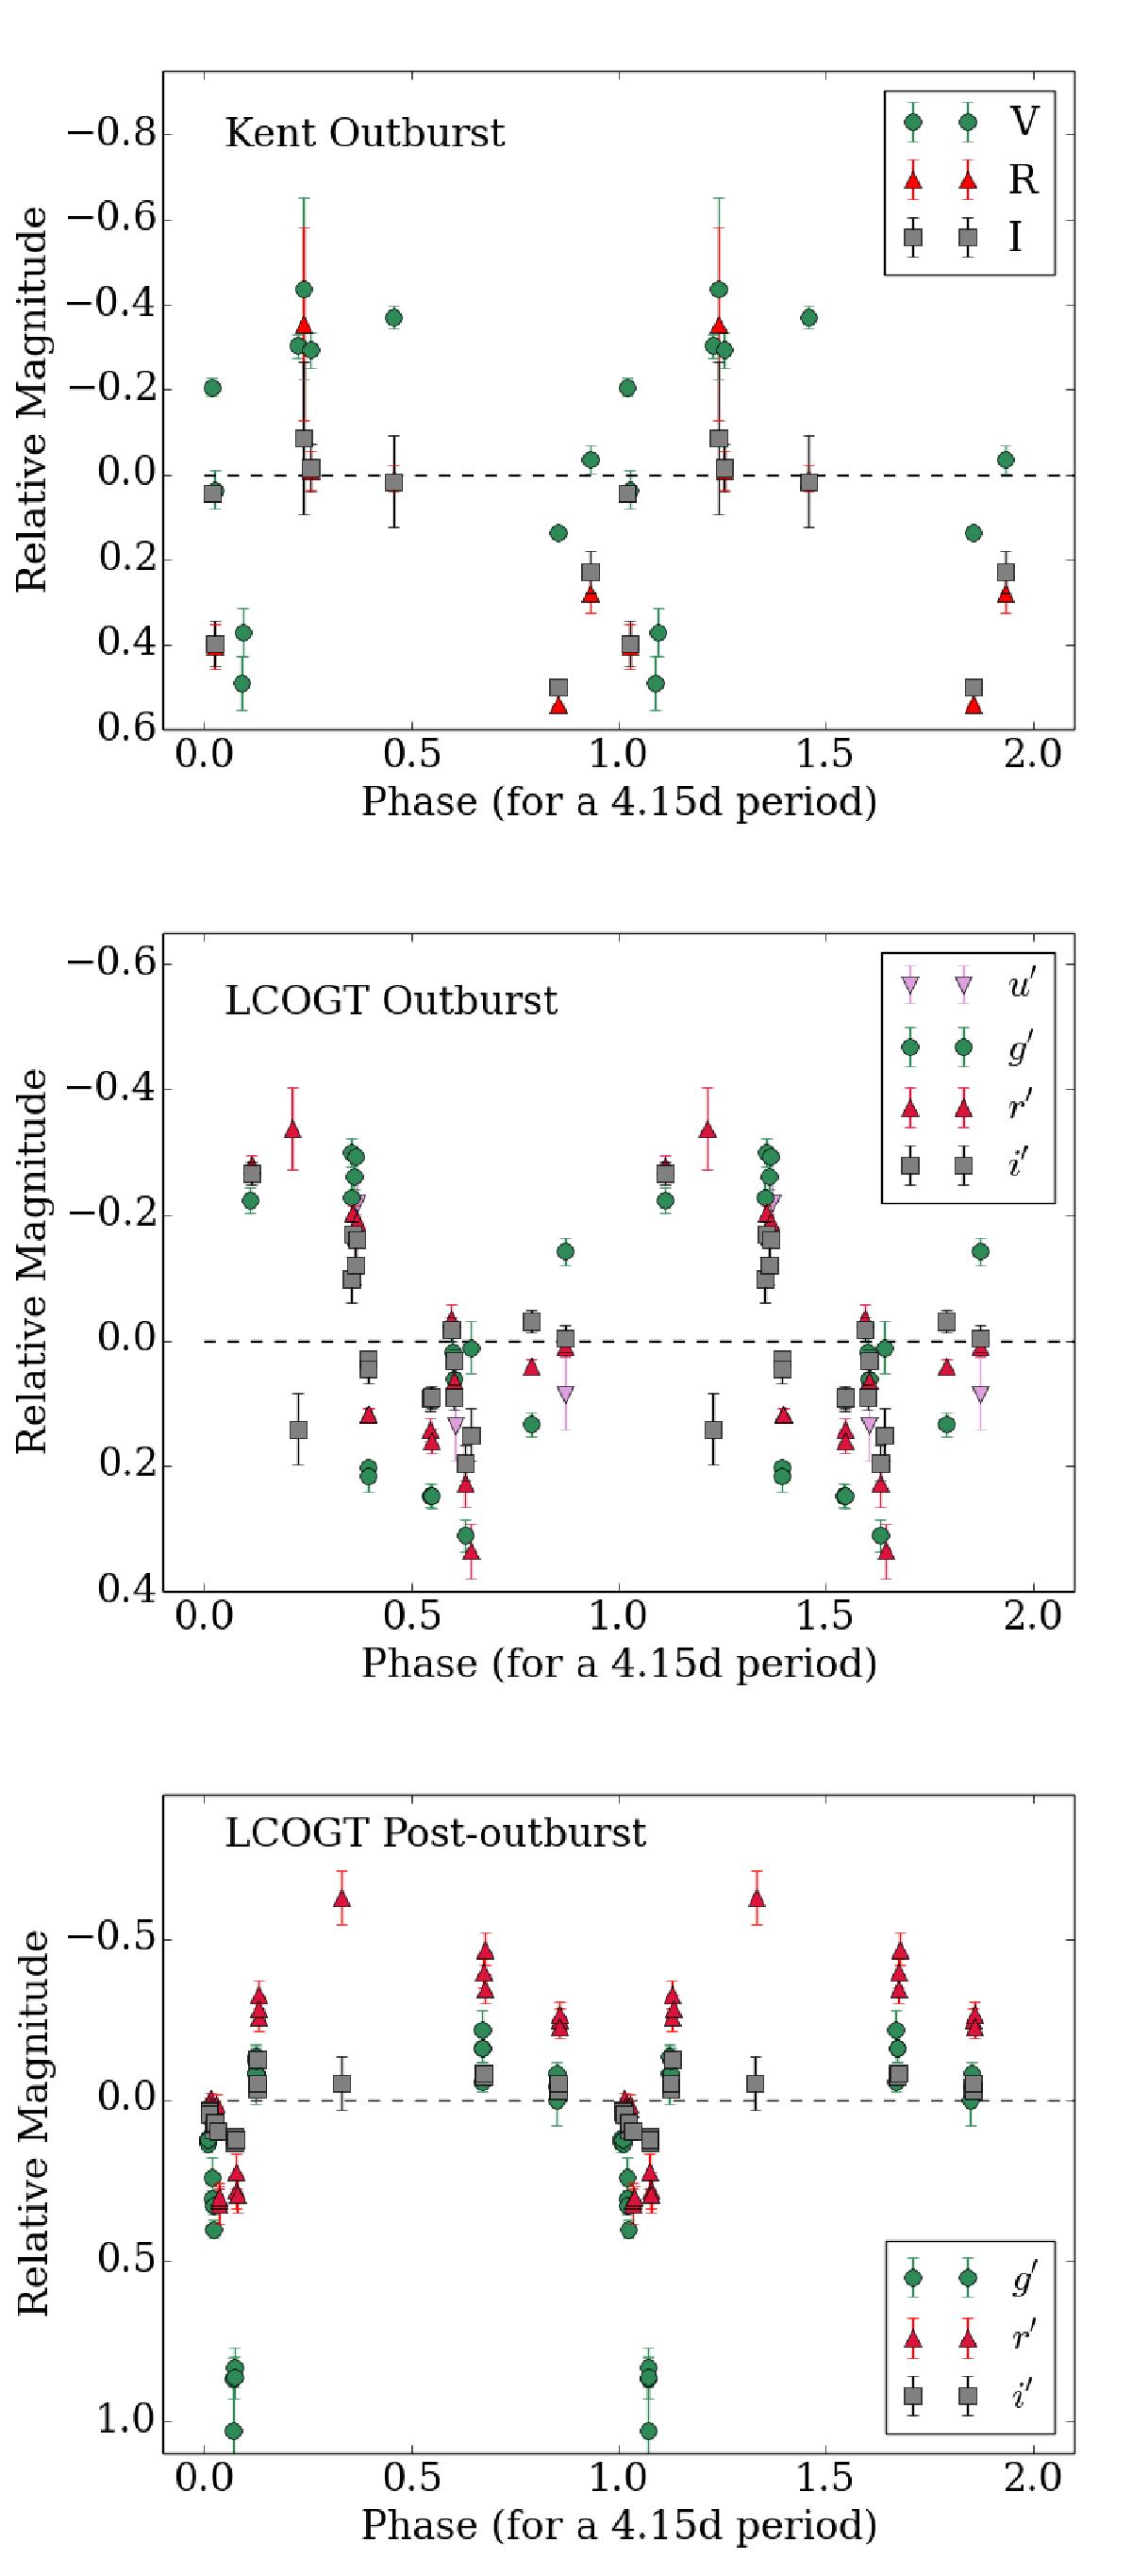
Top: phase-folded light curve for the data from the Beacon Observatory, using the 4.15 d period. Middle: phase-folded light curve for the LCOGT data during outburst. Bottom: phase-folded light curve for the LCOGT data during the post-outburst. All datasets are repeated to show two complete phases, and scaled to the average magnitudes. We note the phase shift between the datasets, which could be due to evolution of the spots. The color change in the post-outburst phase may show a brief occultation event in the g′ band.
Current usage metrics show cumulative count of Article Views (full-text article views including HTML views, PDF and ePub downloads, according to the available data) and Abstracts Views on Vision4Press platform.
Data correspond to usage on the plateform after 2015. The current usage metrics is available 48-96 hours after online publication and is updated daily on week days.
Initial download of the metrics may take a while.