Free Access
Fig. 1
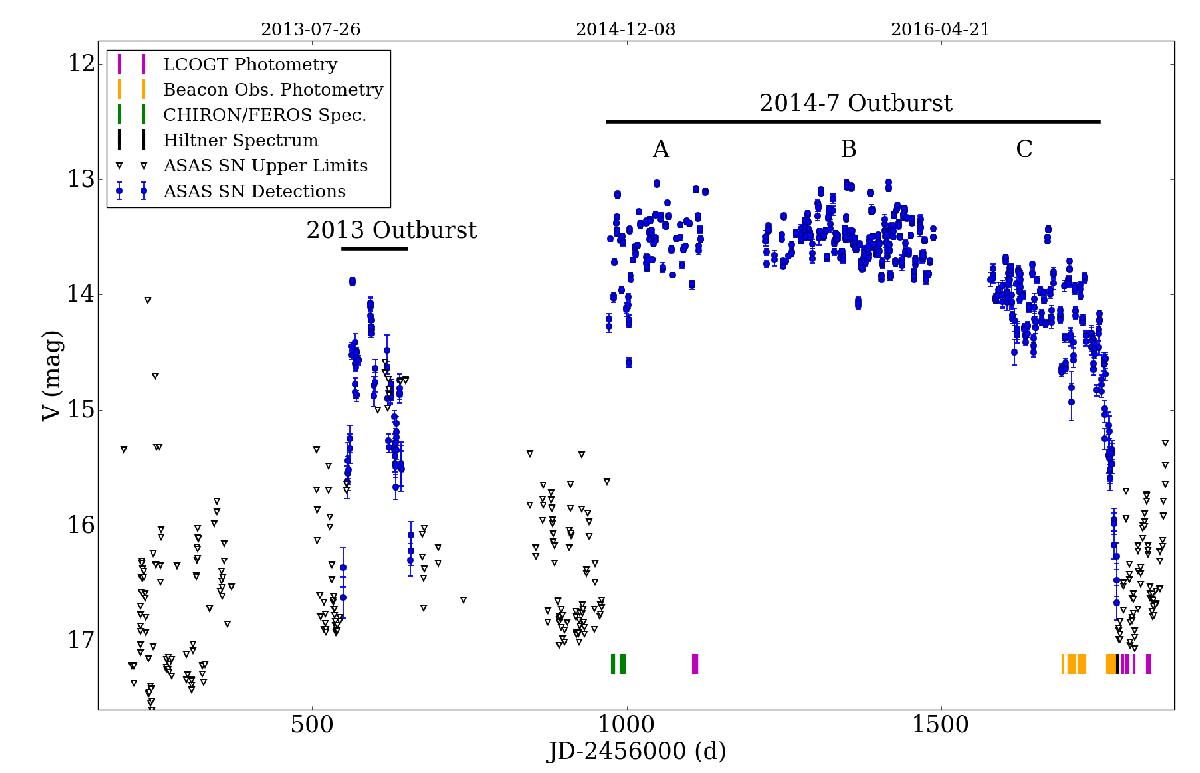
V-band ASASSN-13db light curve from ASAS-SN. Detections and non-detections are shown as dots (with errors) and inverted triangles, respectively. The dates at which we acquired the rest of the observations and the periods of the two known outbursts are also marked.
Current usage metrics show cumulative count of Article Views (full-text article views including HTML views, PDF and ePub downloads, according to the available data) and Abstracts Views on Vision4Press platform.
Data correspond to usage on the plateform after 2015. The current usage metrics is available 48-96 hours after online publication and is updated daily on week days.
Initial download of the metrics may take a while.