Fig. 3
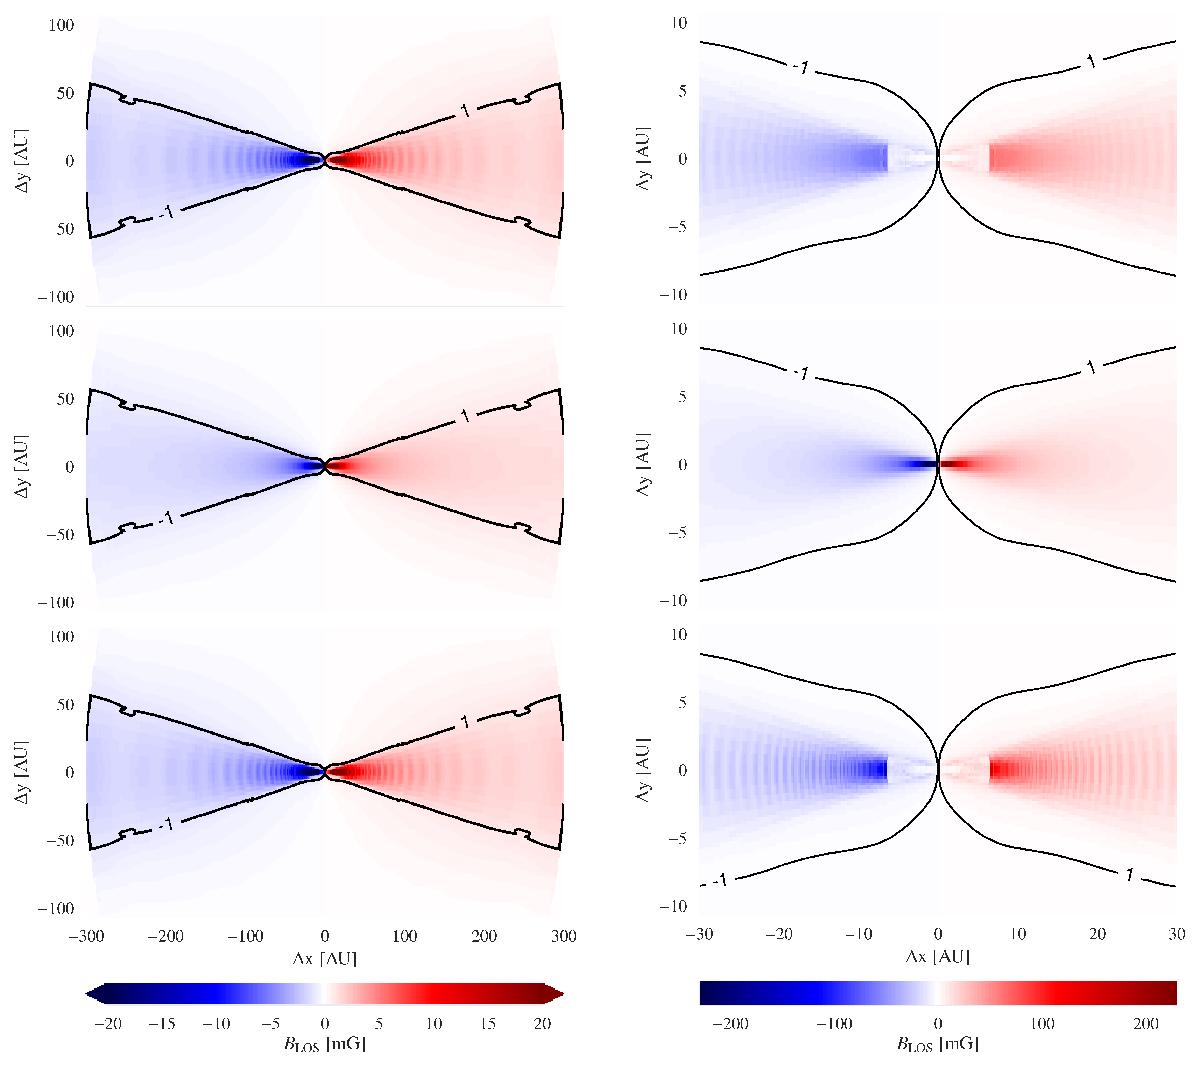
Derived (upper and lower) and reference (middle) LOS magnetic field strength calculated for each pixel of the simulated velocity channel map of the reference circumstellar disk model (113.144 GHz (upper) and 113.170 GHz (lower) CN line emission). The images on the right side are zoomed in on the center by a factor of 10. The faint wave-like structure in the upper and lower images comes from the continuous analytical model and the calculation of the derivative of the spectral line profile, which is composed of a finite number of velocity channels.
Current usage metrics show cumulative count of Article Views (full-text article views including HTML views, PDF and ePub downloads, according to the available data) and Abstracts Views on Vision4Press platform.
Data correspond to usage on the plateform after 2015. The current usage metrics is available 48-96 hours after online publication and is updated daily on week days.
Initial download of the metrics may take a while.