Fig. 9
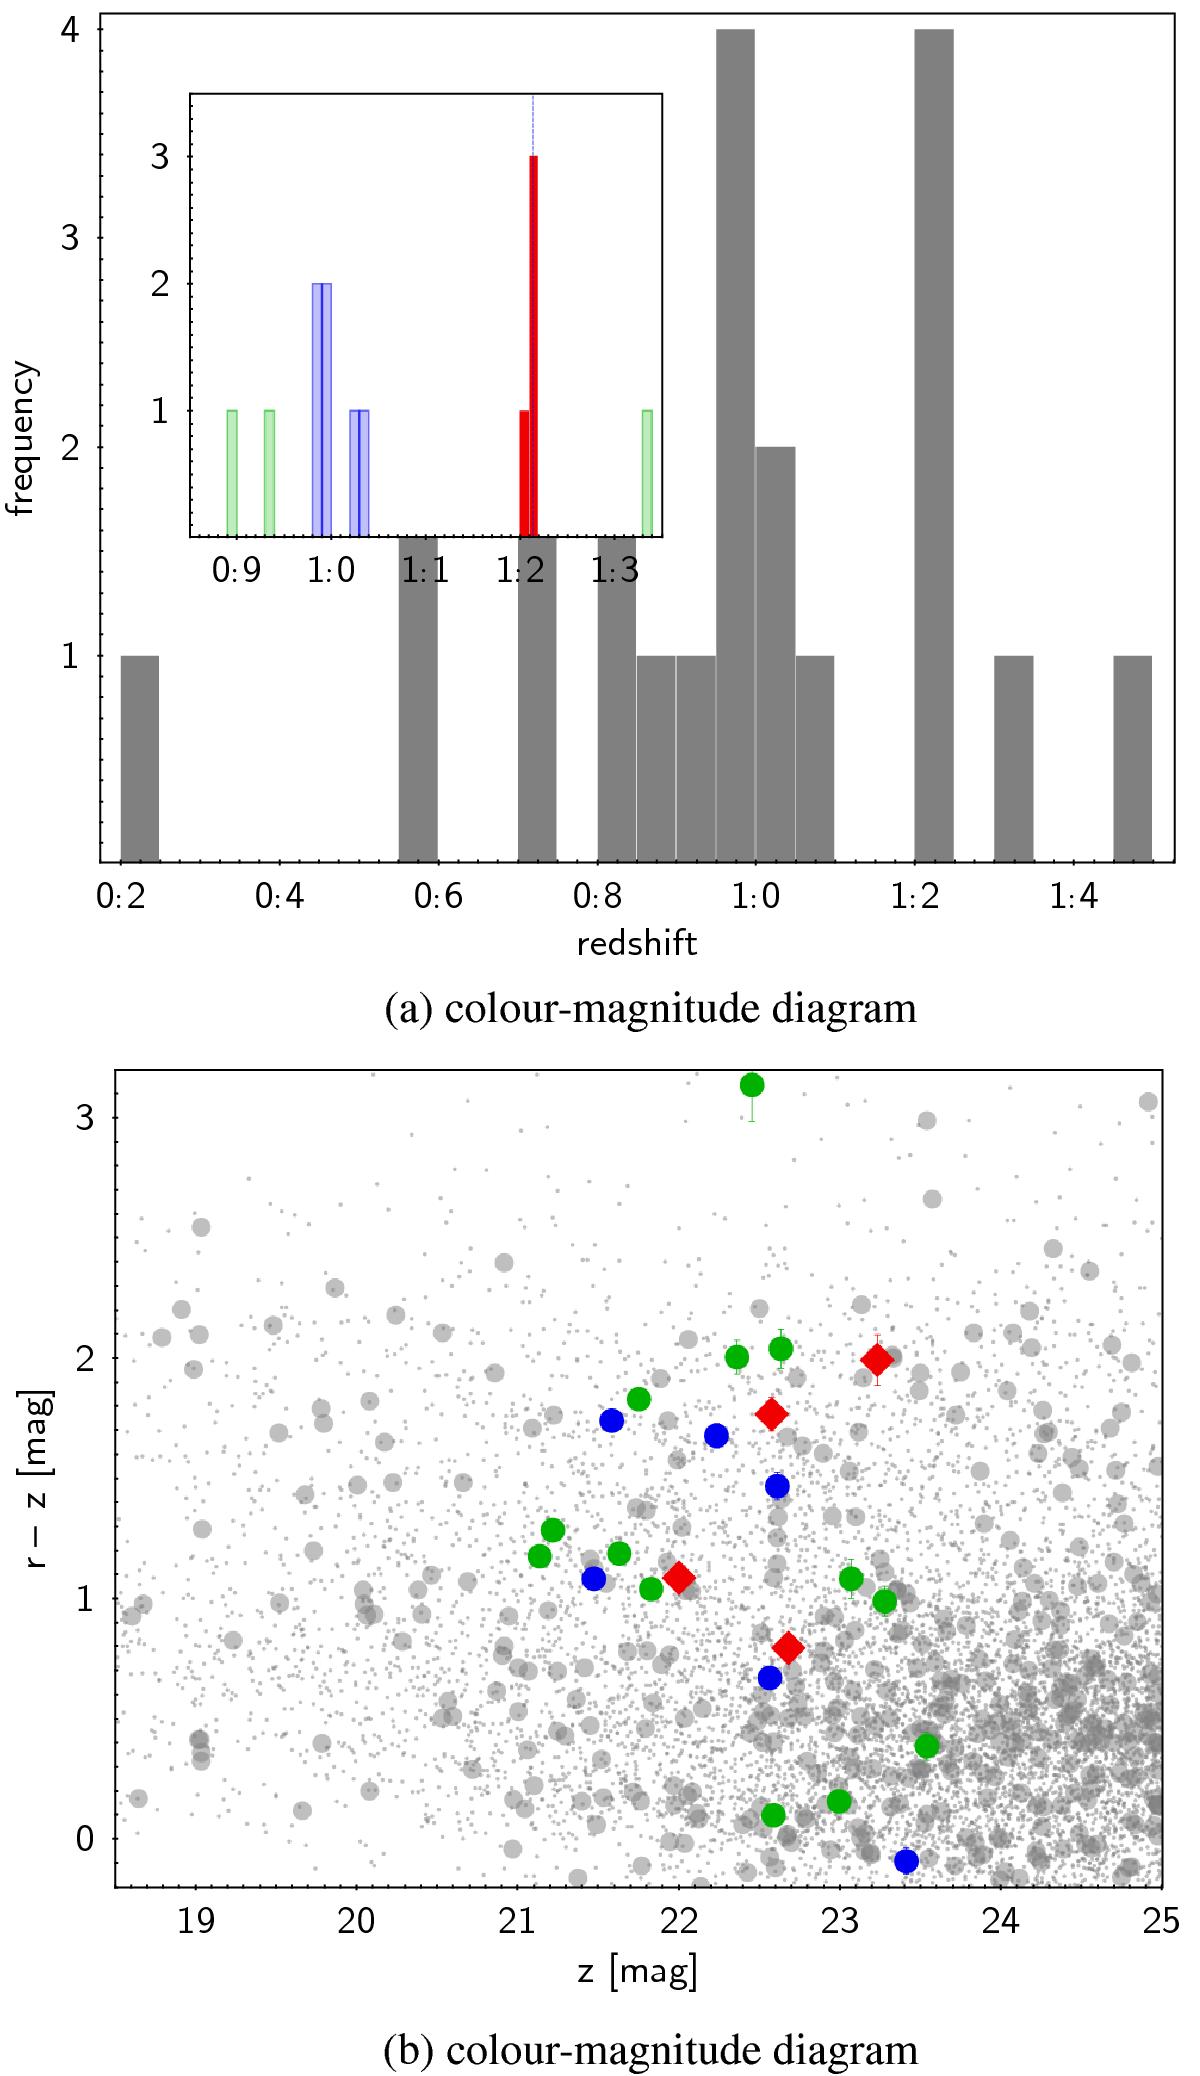
Redshift histogram (top panel) and colour–magnitude diagram (bottom) of 2XMMp J092120.2+371735. Objects with spectra are marked green, while the members of the high-redshift group are shown in red. Blue refers to the foreground population of galaxies, which is unlikely to be responsible for the X-ray emission. Error bars plotted in panel b indicate the photometric uncertainties and are visible when they exceed the symbol size.
Current usage metrics show cumulative count of Article Views (full-text article views including HTML views, PDF and ePub downloads, according to the available data) and Abstracts Views on Vision4Press platform.
Data correspond to usage on the plateform after 2015. The current usage metrics is available 48-96 hours after online publication and is updated daily on week days.
Initial download of the metrics may take a while.