Fig. 6
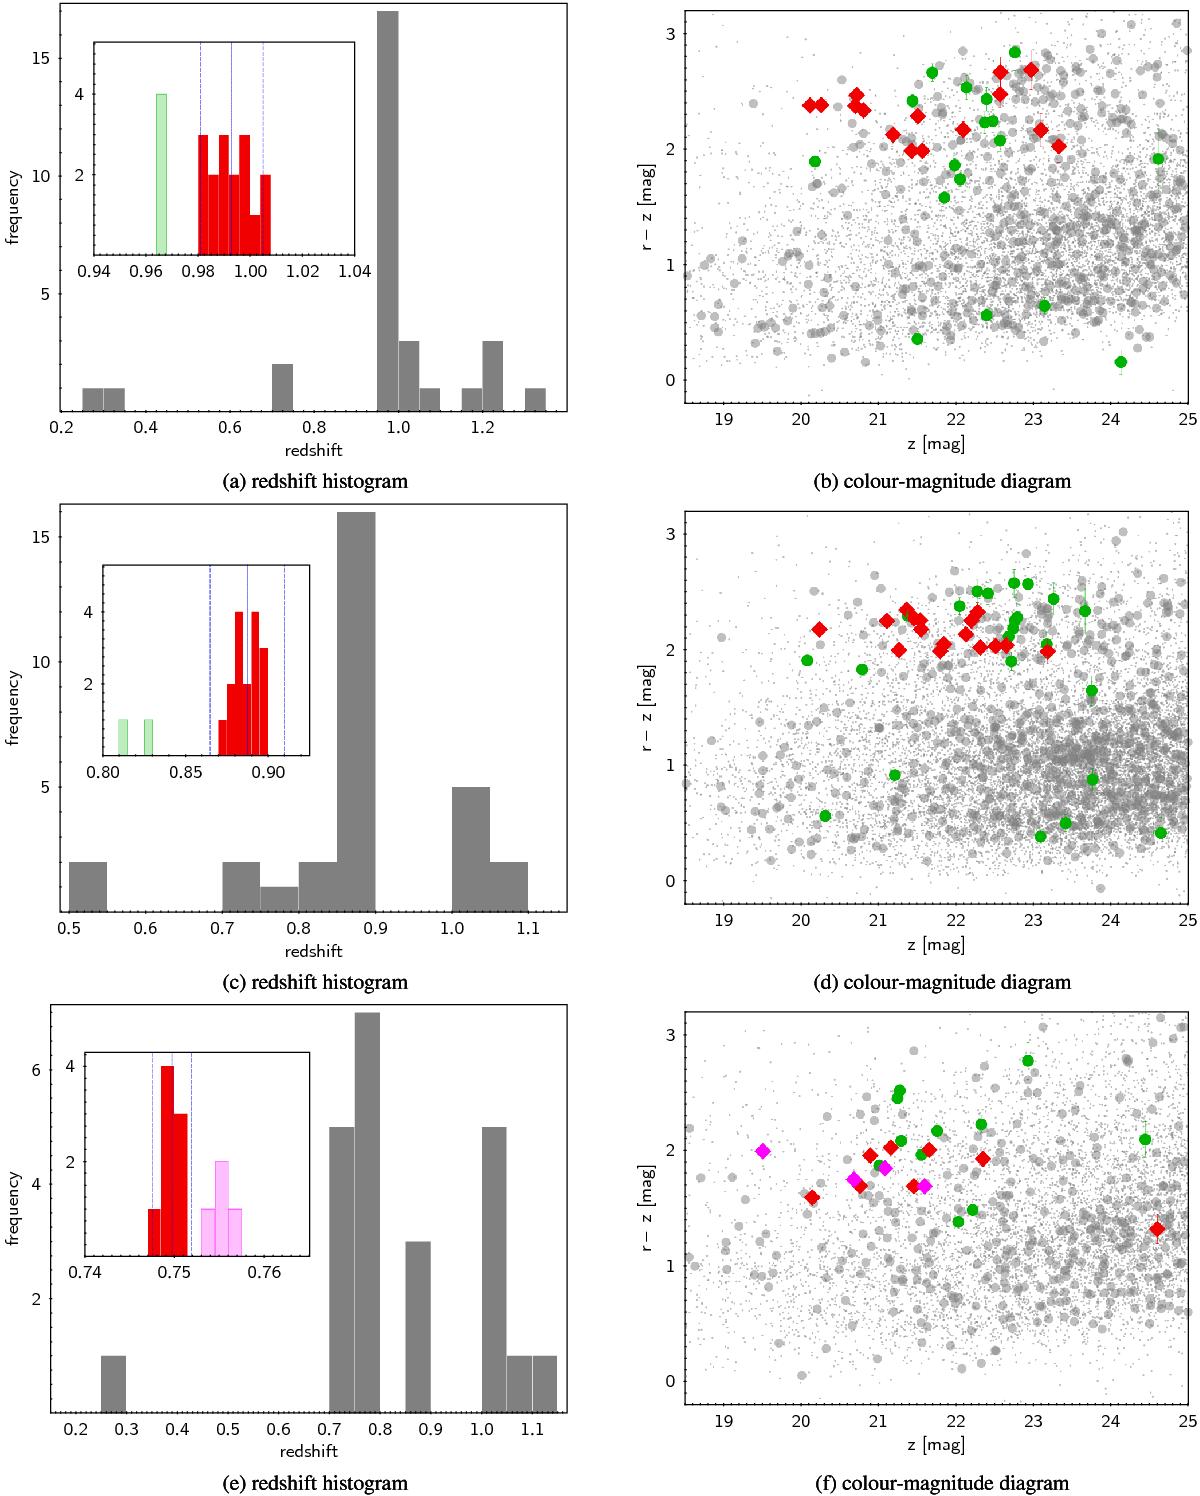
Redshift histograms (left side) and colour–magnitude diagrams (right side) of 2XMMp J120815.5+250001 (top), 2XMMp J123759.3+180332 (middle), and 2XMMp J133853.9+482033 (bottom). Objects with spectra are plotted in green, while the confirmed cluster members are shown in red. Error bars plotted in the colour–magnitude diagrams indicate the photometric uncertainties and are visible when they exceed the symbol size. Galaxies excluded by the iterative sigma clipping method are shown in purple in panels e and f.
Current usage metrics show cumulative count of Article Views (full-text article views including HTML views, PDF and ePub downloads, according to the available data) and Abstracts Views on Vision4Press platform.
Data correspond to usage on the plateform after 2015. The current usage metrics is available 48-96 hours after online publication and is updated daily on week days.
Initial download of the metrics may take a while.