Fig. C.3
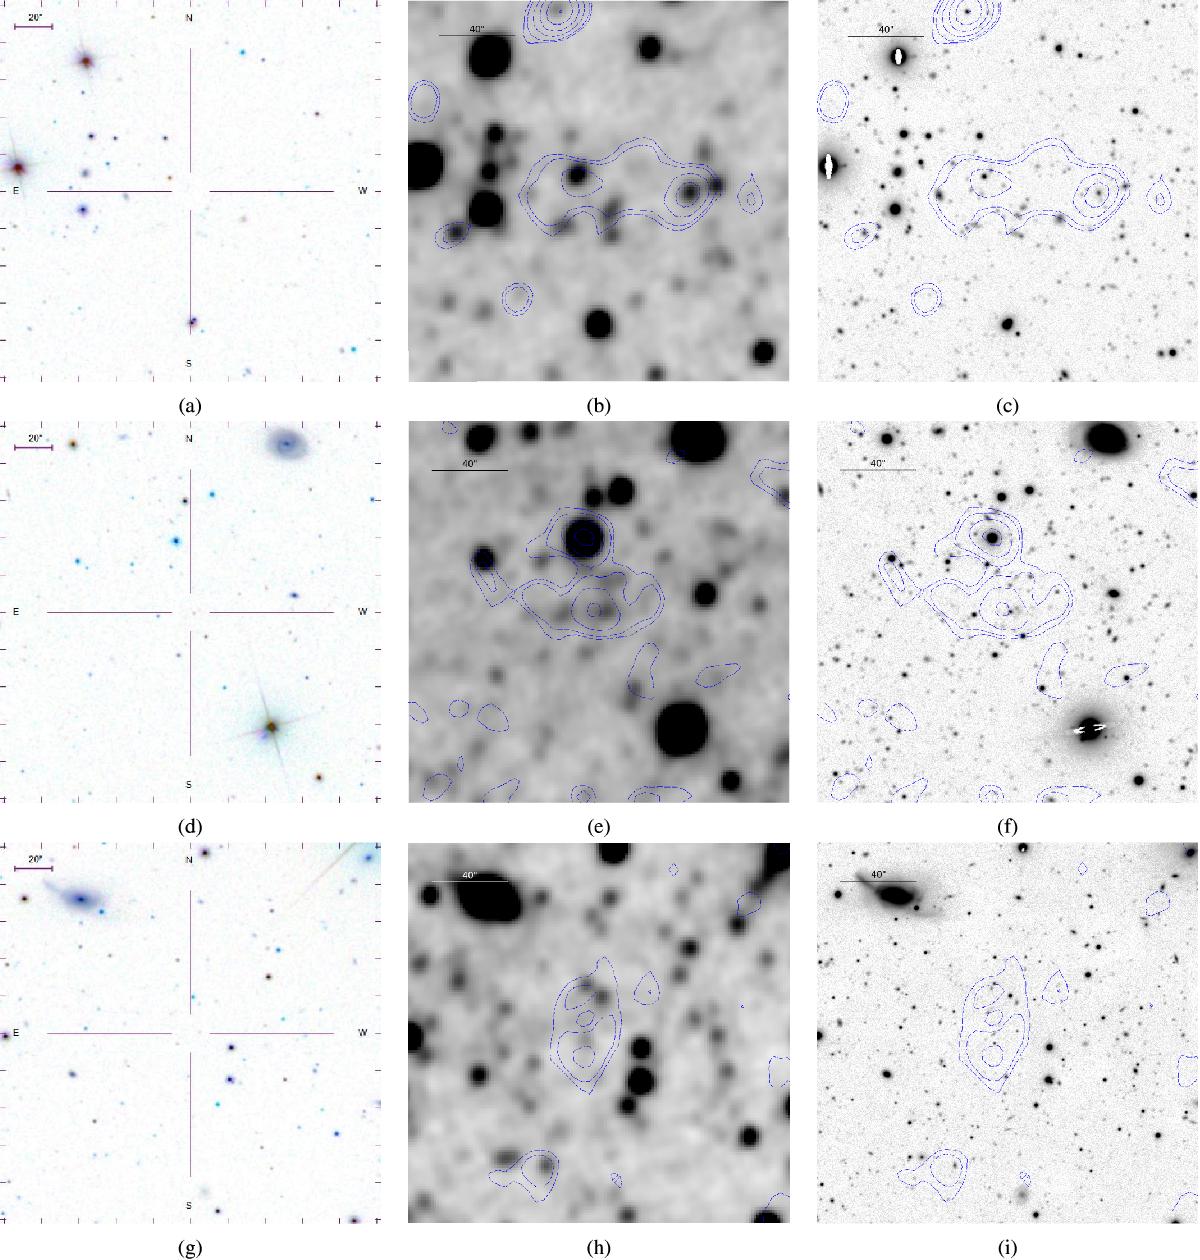
Optical and near-IR images of the fields of 2XMMp J144854.8+085400 (top row), 2XMMp J145220.8+165458 (middle), and 2XMMp J151716.8+001302 (bottom). The first column shows SDSS cutouts of the respective fields, the central column the W1-band (3.4 μm) images from the AllWISE survey, and on the right side, we present LBC images (mean of the r- and z-SLOAN filters). Images of each row are centred at the respective X-ray positions and show the same region of the sky. Blue dashed lines (middle and right images) indicate contours from the X-ray flux, where the levels are chosen for illustration alone. North is up, east is left, and the images are centred on the respective X-ray position.
Current usage metrics show cumulative count of Article Views (full-text article views including HTML views, PDF and ePub downloads, according to the available data) and Abstracts Views on Vision4Press platform.
Data correspond to usage on the plateform after 2015. The current usage metrics is available 48-96 hours after online publication and is updated daily on week days.
Initial download of the metrics may take a while.