Fig. C.1
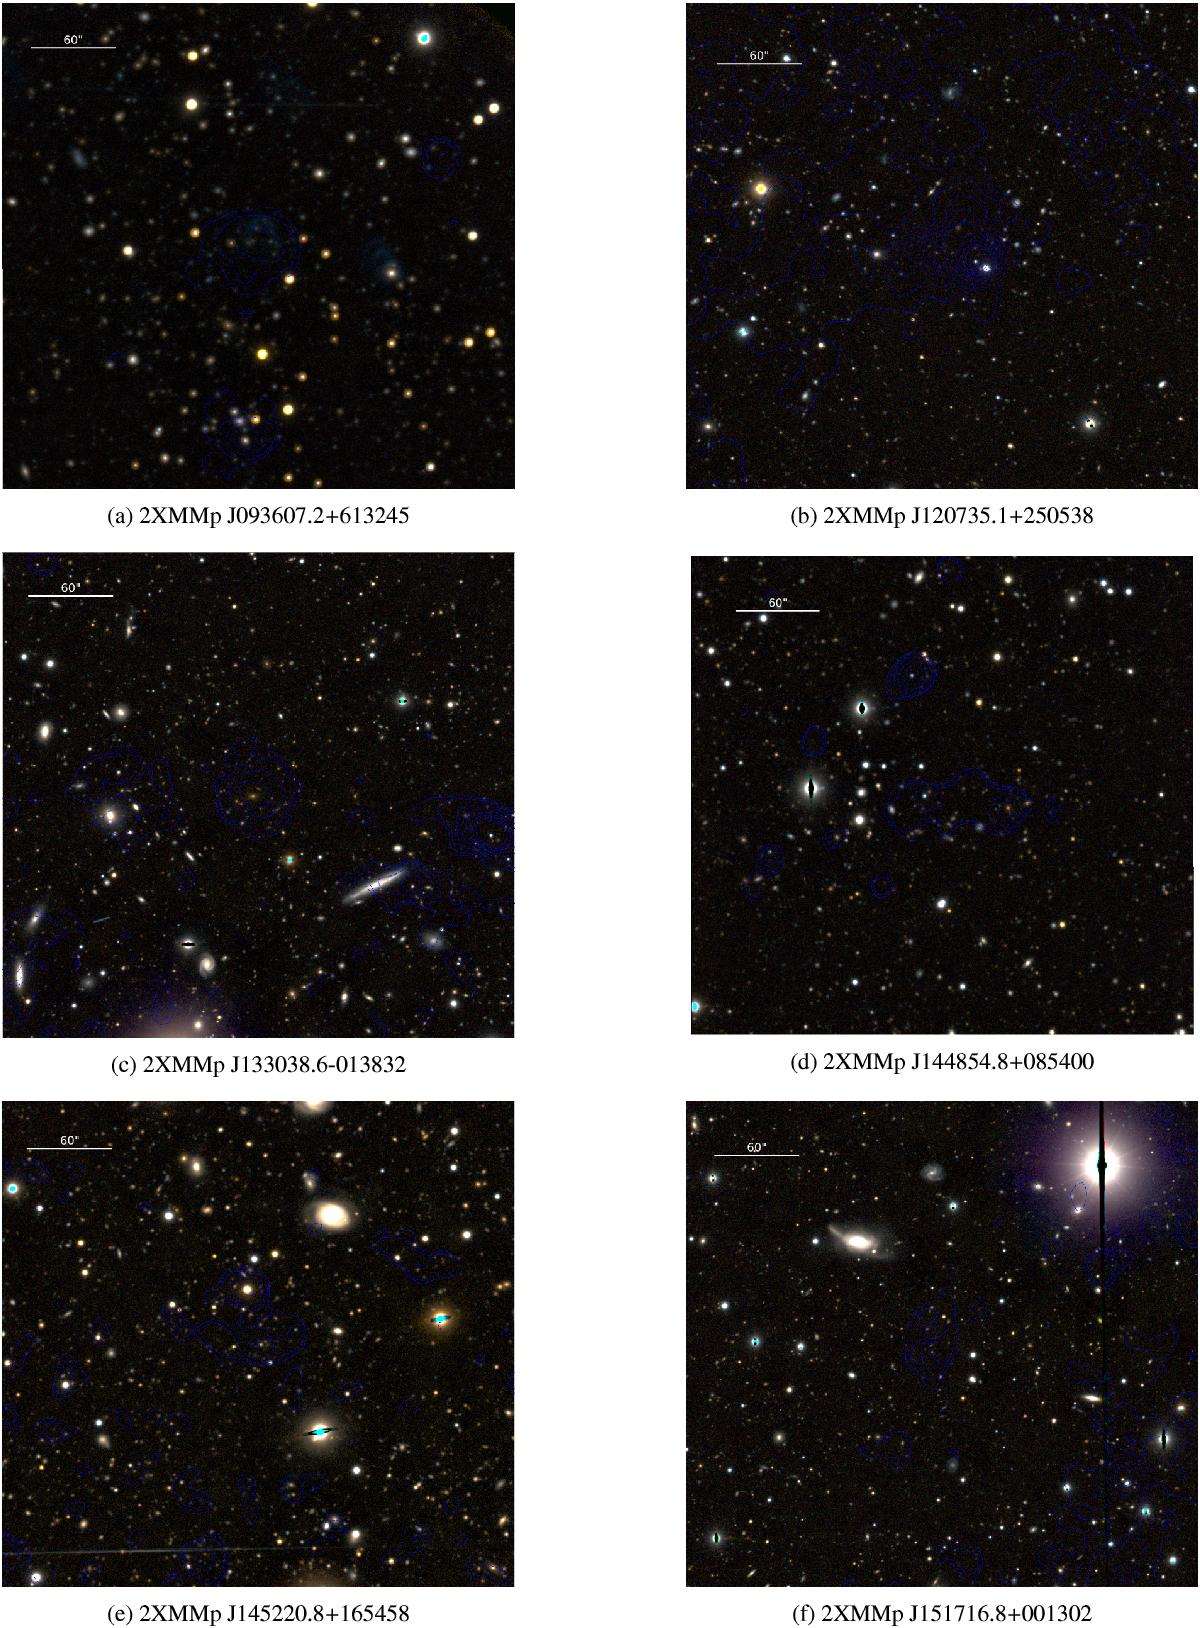
LBC colour images of the rejected or unclassified fields of Sect. 6.5. We assigned r-SLOAN and z-SLOAN images from the LBC to the blue and red channel of the colour image. The green channel was created from the mean of both bands. Blue dashed lines are the contours from the X-ray emission, but not at the same flux levels for all subimages. North is up, east is left, and the images are centred on the respective X-ray position.
Current usage metrics show cumulative count of Article Views (full-text article views including HTML views, PDF and ePub downloads, according to the available data) and Abstracts Views on Vision4Press platform.
Data correspond to usage on the plateform after 2015. The current usage metrics is available 48-96 hours after online publication and is updated daily on week days.
Initial download of the metrics may take a while.