Fig. B.1
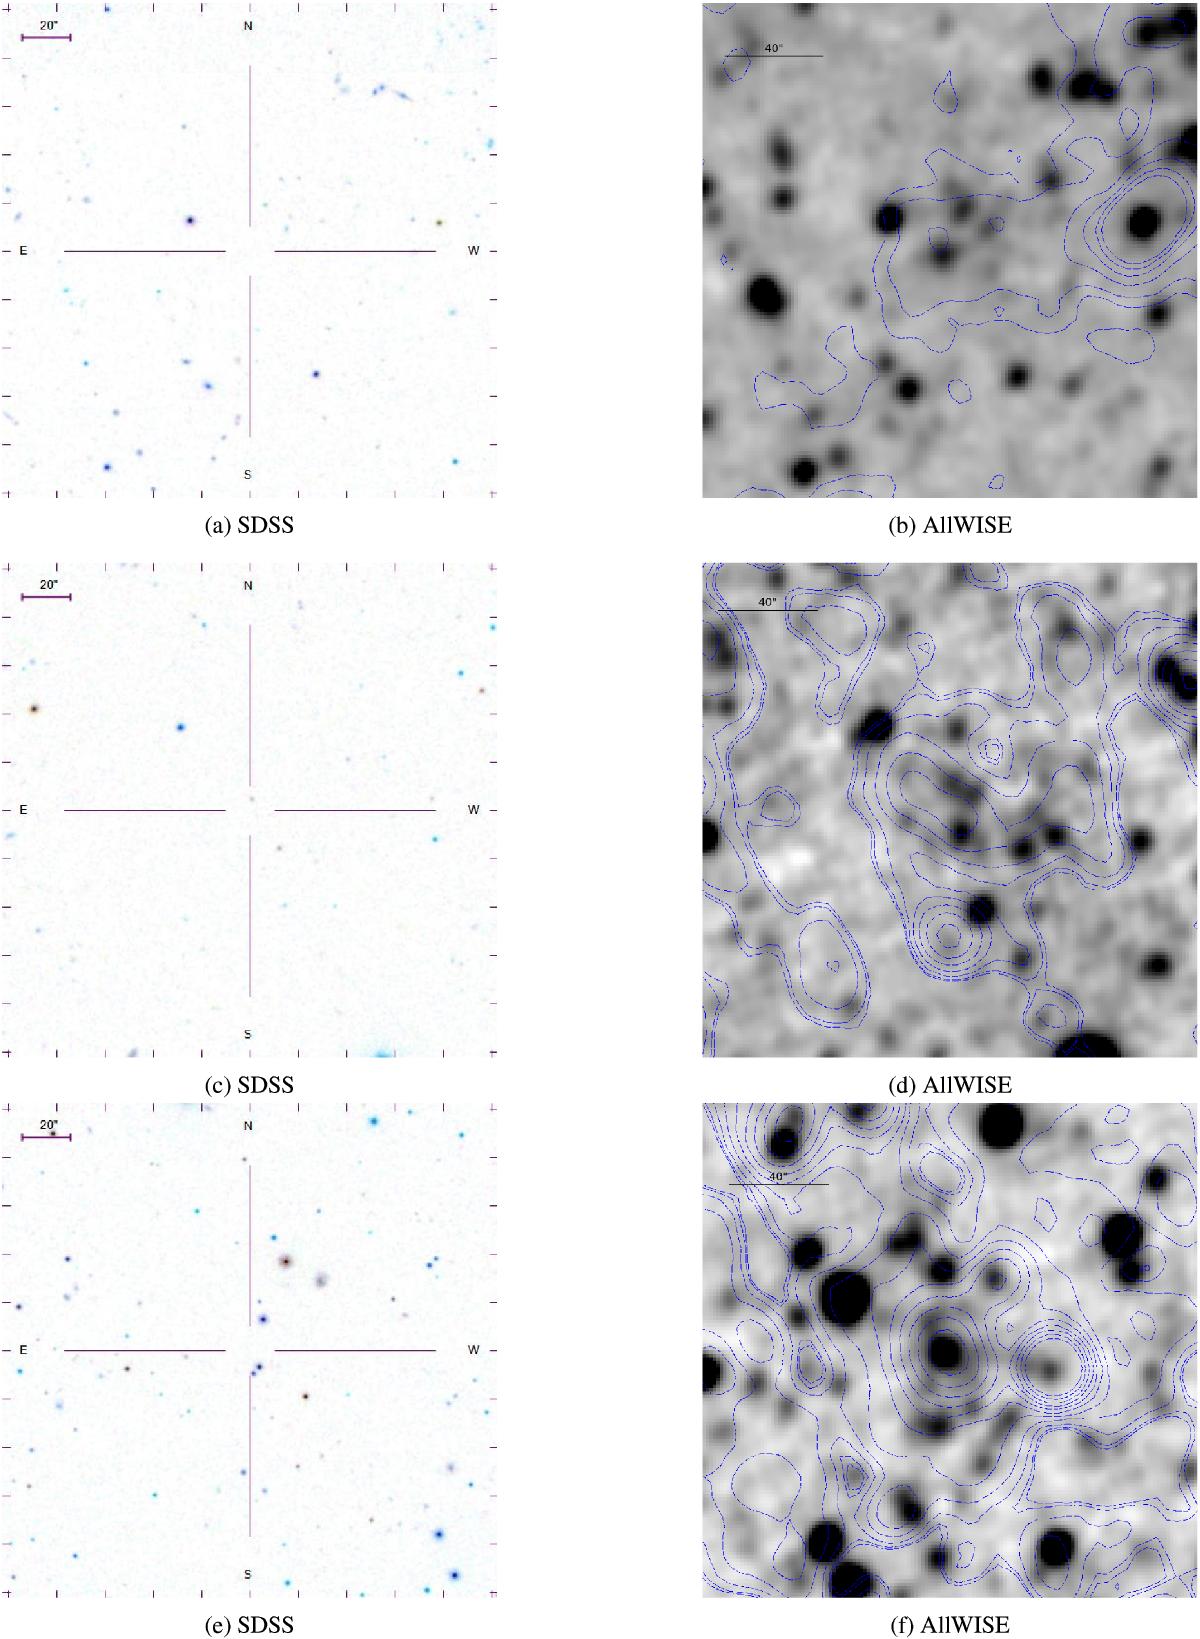
Optical and near-IR images of the fields 2XMMp J030212.0-000133 (top panels), 2XMMp J084836.4+445345 (middle), and 2XMMp J084858.3+445158 (bottom). North is up, east is left, and both images cover the same region. Figures on the left side show SDSS DR6 images, while W1-band (3.4 μm) images from the AllWISE survey are on the right side. Blue dashed lines are the contours from the X-ray emission, but not at the same flux levels.
Current usage metrics show cumulative count of Article Views (full-text article views including HTML views, PDF and ePub downloads, according to the available data) and Abstracts Views on Vision4Press platform.
Data correspond to usage on the plateform after 2015. The current usage metrics is available 48-96 hours after online publication and is updated daily on week days.
Initial download of the metrics may take a while.