Fig. 1
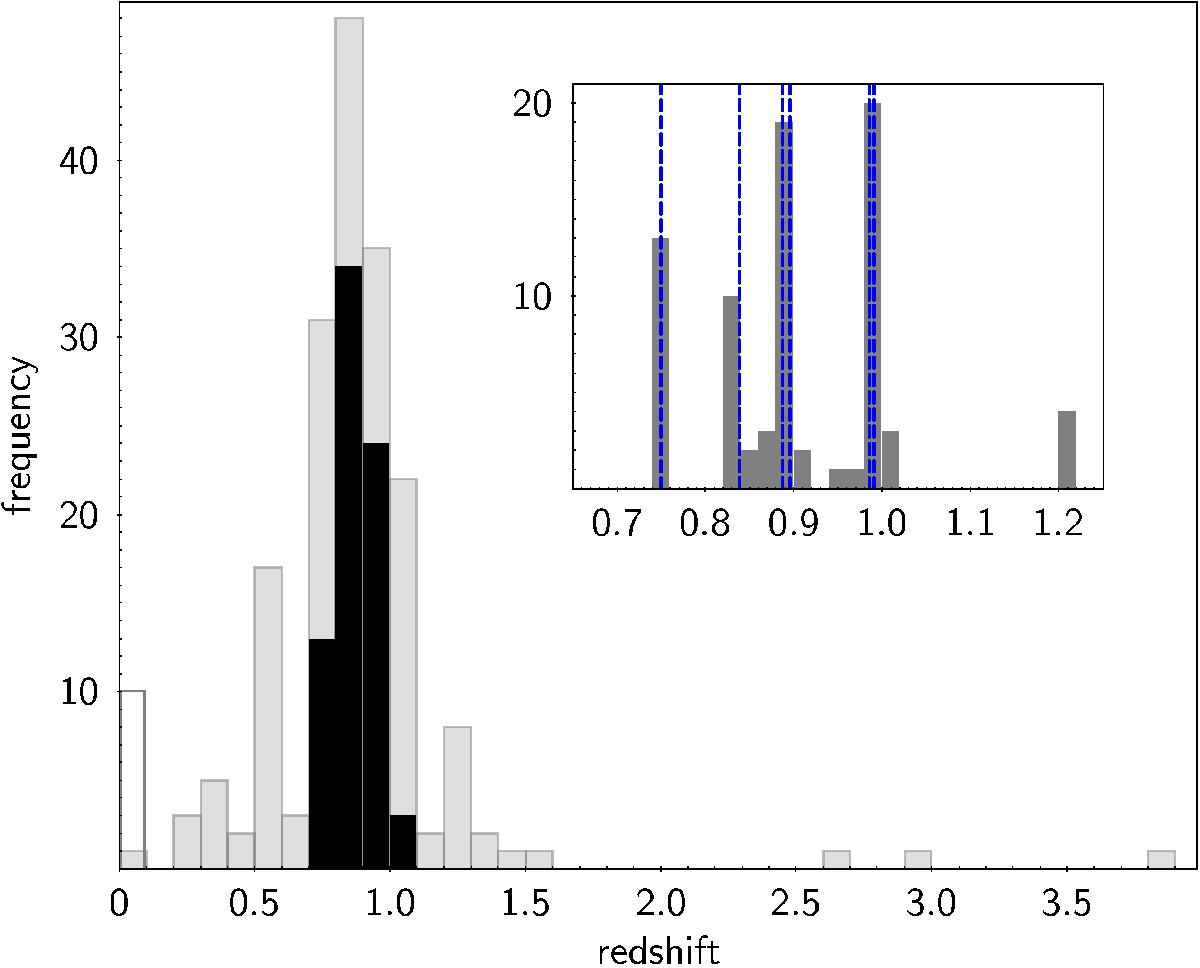
Histogram built from all spectra of our spectroscopic observations. The transparent region in the main plot marks the content of stars identified in the sample, the light shaded regions reflect the content of galaxies, where the fraction of all identified cluster member galaxies is plotted black. The inset details the mean cluster redshift as vertical blue dashed lines overplotted on the histogram of the identified member galaxies that match our selection criteria.
Current usage metrics show cumulative count of Article Views (full-text article views including HTML views, PDF and ePub downloads, according to the available data) and Abstracts Views on Vision4Press platform.
Data correspond to usage on the plateform after 2015. The current usage metrics is available 48-96 hours after online publication and is updated daily on week days.
Initial download of the metrics may take a while.