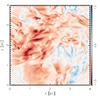
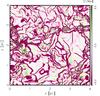
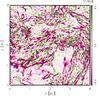
Fig. 7
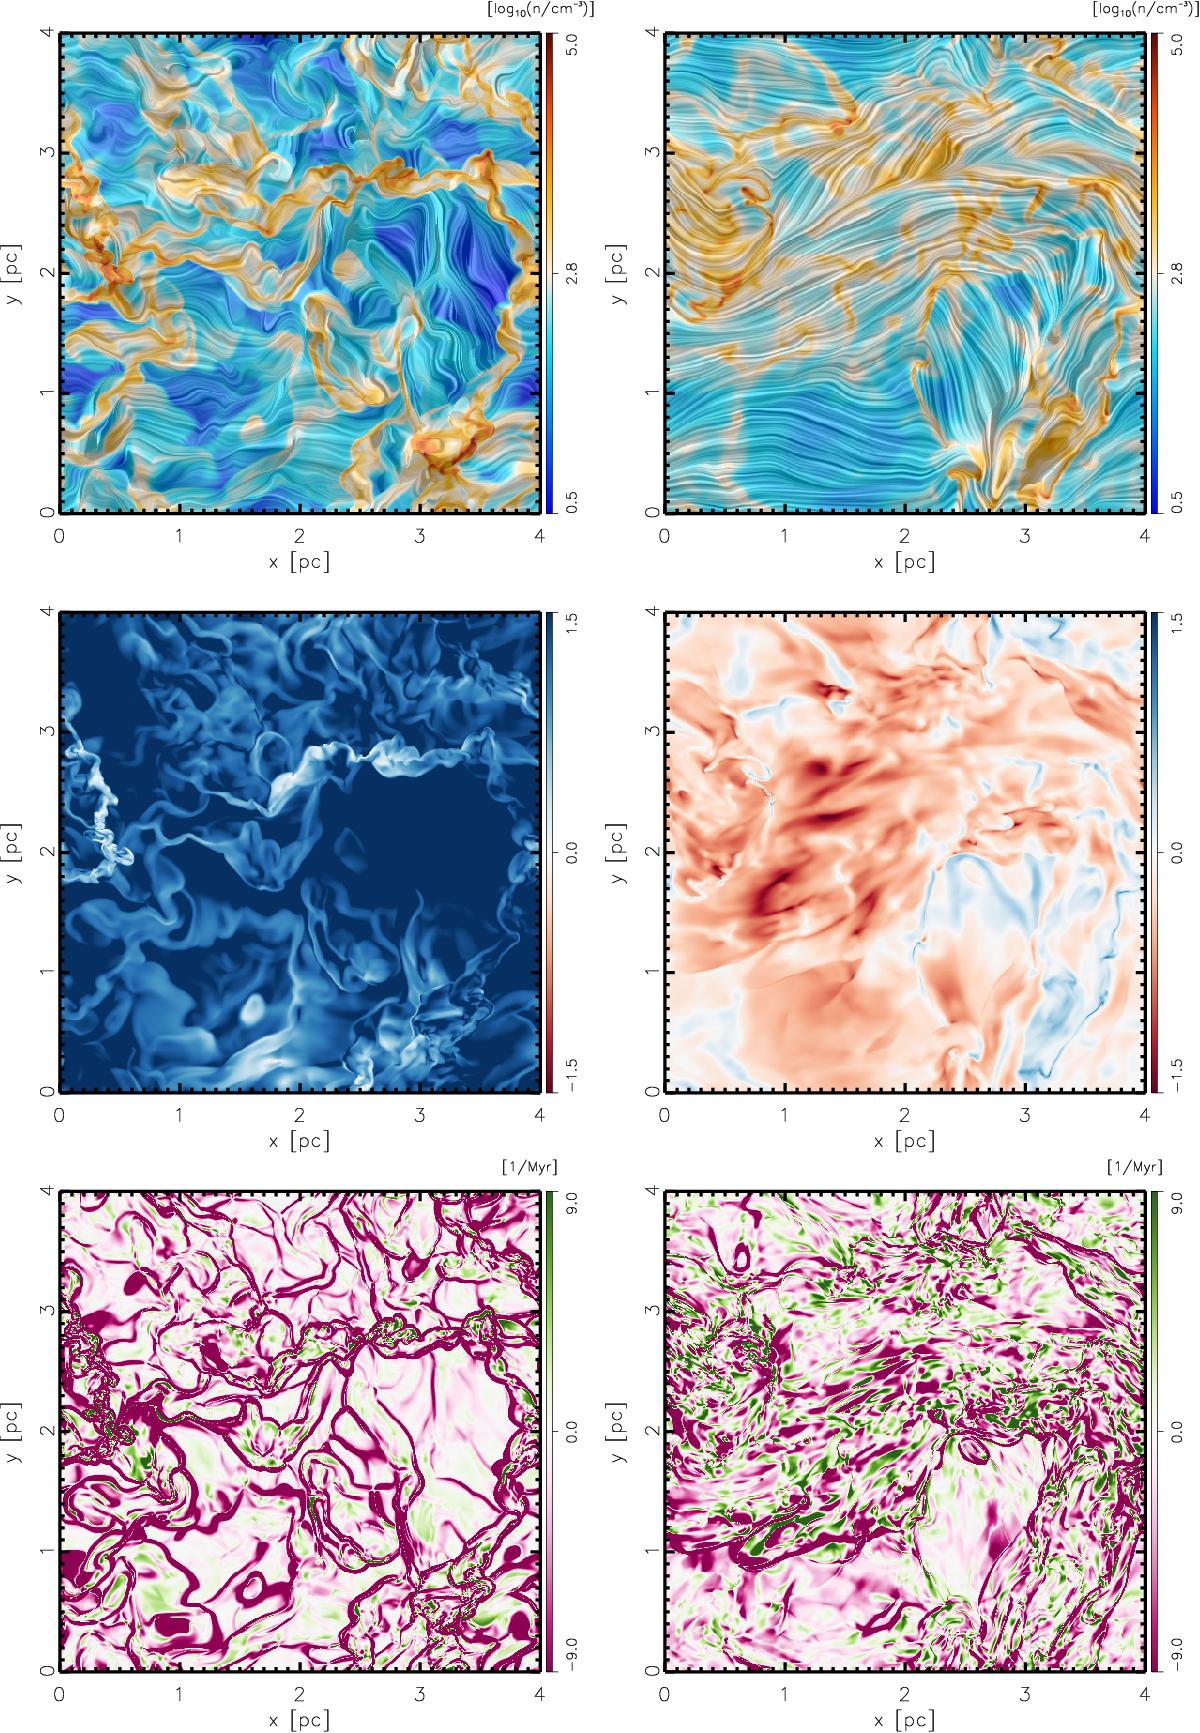
Distributions of the density and magnetic field (top), the logarithm of the Alfvén Mach number ℳA (middle), and the coefficient A23 of Eq. (13)(bottom) in a slice (z = 256) of the MHD turbulence simulations used in Soler et al. (2013) for initially weak (β = 100, left) and strong (β = 0.1, right) magnetic field in a snapshot taken at one-third of the flow crossing time. The coefficient A23 is the term dominating the change in the relative orientation between ∇ρ and B according to Eq. (13).
Current usage metrics show cumulative count of Article Views (full-text article views including HTML views, PDF and ePub downloads, according to the available data) and Abstracts Views on Vision4Press platform.
Data correspond to usage on the plateform after 2015. The current usage metrics is available 48-96 hours after online publication and is updated daily on week days.
Initial download of the metrics may take a while.