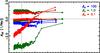
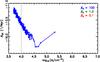
Fig. 5
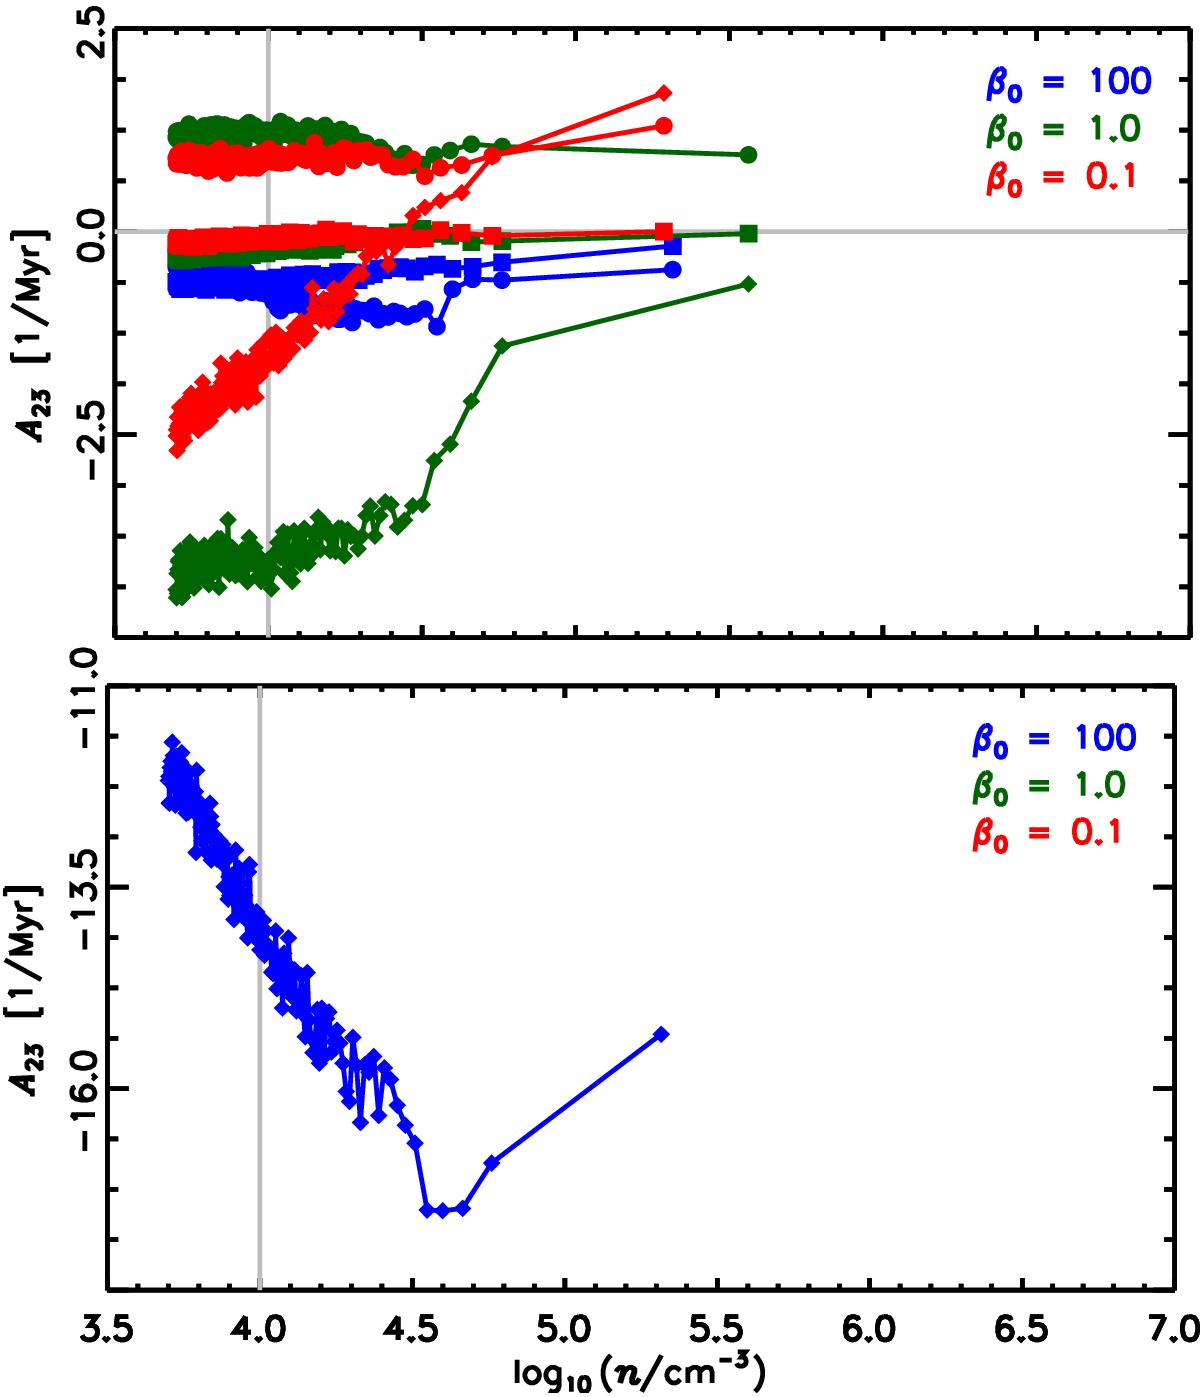
Mean values of the principal components of A23, defined in Eq. (26), as a function of density, n, in the simulations introduced in Soler et al. (2013). The component associated with the most negative eigenvalue of the symmetric part of the strain tensor, which corresponds to the dominant compressive mode, is represented by the diamonds. These values are outside of the range in the case of the β0 = 100 simulation, thus they are presented separately in the lower panel. The intermediate and maximum eigenvalues are represented by circles and squares, respectively.
Current usage metrics show cumulative count of Article Views (full-text article views including HTML views, PDF and ePub downloads, according to the available data) and Abstracts Views on Vision4Press platform.
Data correspond to usage on the plateform after 2015. The current usage metrics is available 48-96 hours after online publication and is updated daily on week days.
Initial download of the metrics may take a while.