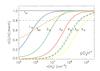
Fig. A.1
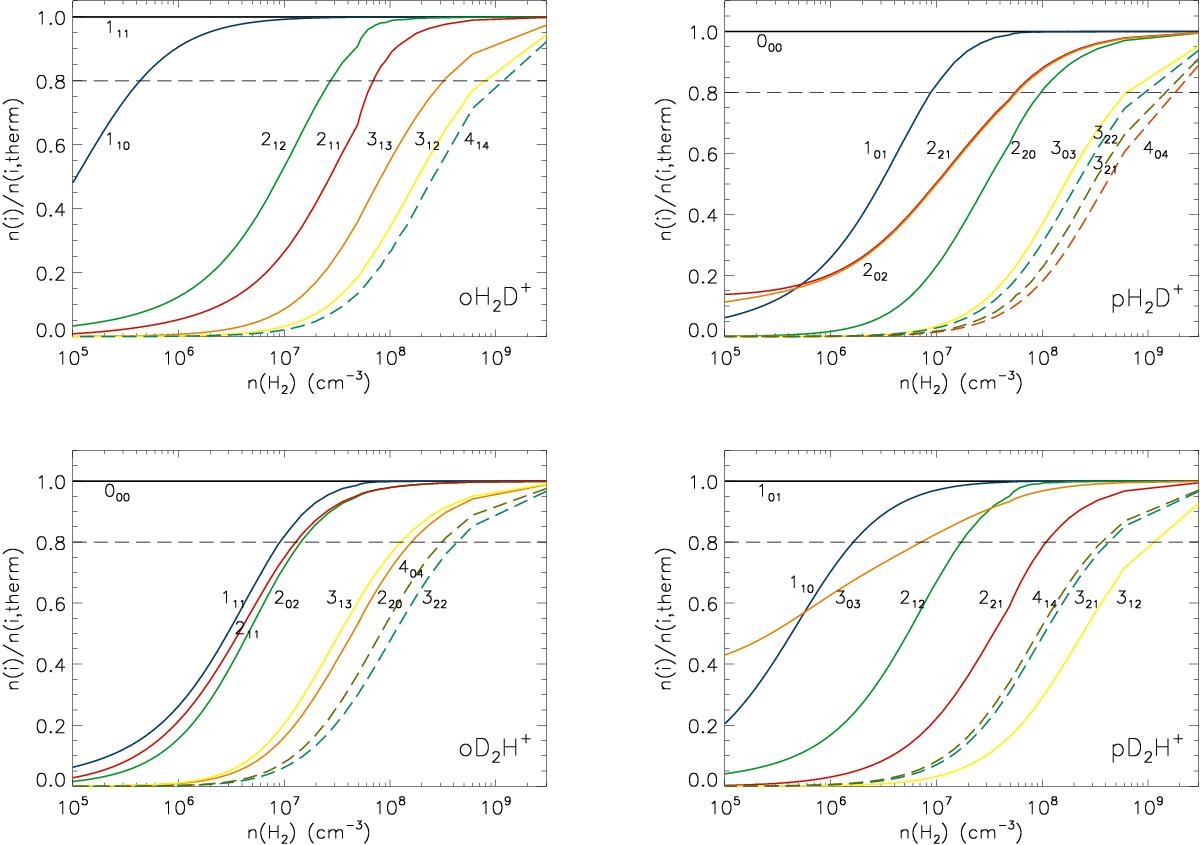
Excitation of the lowest rotational levels of oH2D+, pH2D+, oD2H+, and pD2H+ as functions of the gas density at T = 15 K, assuming a fractional abundance X = 10-10 for each species. The curves show the ratios of the populations to the values expected from the Boltzmann distribution. The dashed horizontal lines indicates the limit where a level is considered to be significantly populated and taken into account in the calculation of the species-to-species rate coefficients.
Current usage metrics show cumulative count of Article Views (full-text article views including HTML views, PDF and ePub downloads, according to the available data) and Abstracts Views on Vision4Press platform.
Data correspond to usage on the plateform after 2015. The current usage metrics is available 48-96 hours after online publication and is updated daily on week days.
Initial download of the metrics may take a while.