Fig. 6
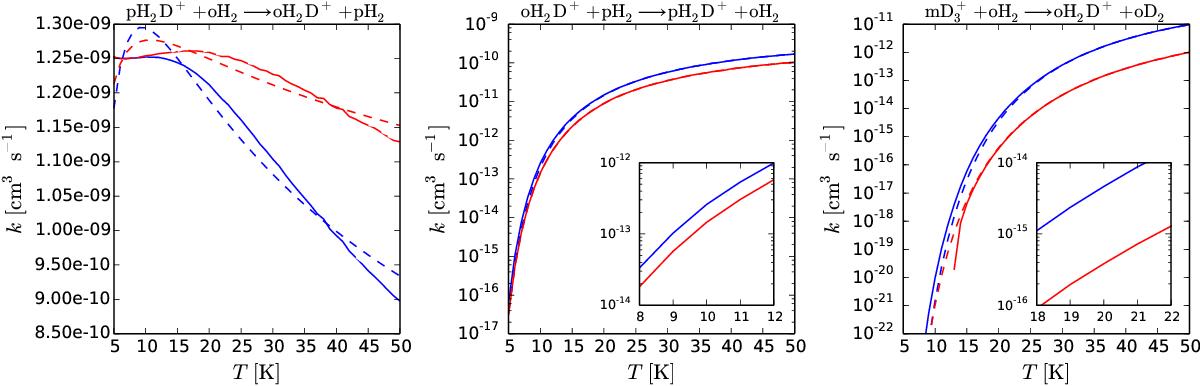
Rate coefficients of the pH2D+ + oH2− → oH2D+ + pH2 (left), oH2D+ + pH2− → pH2D+ + oH2 (middle), and ![]() (right) reactions as functions of temperature. Red lines represent ground-state-to-species rate coefficients, while blue lines represent species-to-species rate coefficients. Solid lines represent the raw data from Hugo et al. (2009), and dashed lines represent our fits using the modified Arrhenius rate law (see text). We highlight the different y-axis scaling in the panels.
(right) reactions as functions of temperature. Red lines represent ground-state-to-species rate coefficients, while blue lines represent species-to-species rate coefficients. Solid lines represent the raw data from Hugo et al. (2009), and dashed lines represent our fits using the modified Arrhenius rate law (see text). We highlight the different y-axis scaling in the panels.
Current usage metrics show cumulative count of Article Views (full-text article views including HTML views, PDF and ePub downloads, according to the available data) and Abstracts Views on Vision4Press platform.
Data correspond to usage on the plateform after 2015. The current usage metrics is available 48-96 hours after online publication and is updated daily on week days.
Initial download of the metrics may take a while.