Fig. 5
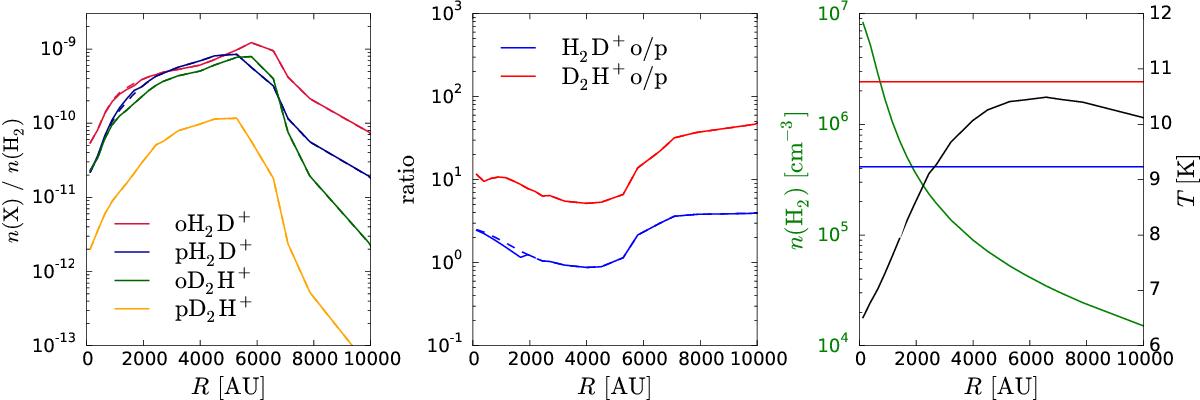
Left: radial distributions of the fractional abundances of the spin states of H2D+ and D2H+ at t = 1 × 10⁶ yr in the innermost 10 000 AU of the L1544 model. Solid lines correspond to the species-to-species model (method 1), while dashed lines correspond to the ground-state-to-species model. Middle: radial distributions of the o/p ratios of H2D+ and D2H+. Linestyles are the same as in the left panel. Right: density and temperature distributions of the L1544 core model. The blue and red horizontal lines mark the critical densities of the first excited rotational transitions of oH2D+ and pD2H+, respectively.
Current usage metrics show cumulative count of Article Views (full-text article views including HTML views, PDF and ePub downloads, according to the available data) and Abstracts Views on Vision4Press platform.
Data correspond to usage on the plateform after 2015. The current usage metrics is available 48-96 hours after online publication and is updated daily on week days.
Initial download of the metrics may take a while.